Engineering features of ad quality
This is the second blog post about our WWW 2016 paper on the pre-click quality of native advertisements. This work is in collaboration with Ke (Adam) Zhou, Miriam Redi and Andy Haines. A big thank you to Miriam Redi for providing examples of visual features.
In a previous post, I reported on a study that led to important insights into how users perceive the quality of native ads. In online services, native advertising is a very popular form of online advertising where the ads served reproduce the look-and-feel of the service in which they appear. Due to the low variability in terms of ad formats in native advertising, the content and the presentation of the ad are important factors contributing to the quality of the ad. The most important factors are, in order of importance:
Aesthetic appeal > Product, Brand, Trustworthiness > Clarity > Layout
Based on this study, we designed a large set of features to characterize these factors. We derived the features from the ad copy (text and image), and the advertiser properties. The text of an ad is made of a title and a description. Most ads have an image. An overview of the features together with their mapping to the reasons is shown below.
| Reasons | Features |
| Brand | Brand (domain pagerank, search term popularity) |
| Product/Service | Content (topic category, adult detector, image objects) |
| Trustworthiness | Psychology (sentiment, psychological incentives) Content Coherence (similarity between title and desc) Language Style (formality, punctuation, superlative) Language Usage (spam, hatespeech, click bait) |
| Clarity | Readability (RIX index, number of complex words) |
| Layout | Readability (number of sentences, words) Image Composition (Presence of objects, symmetry) |
| Aesthetic appeal | Colors (H.S.V, Contrast, Pleasure) Textures (GLCM properties) Photographic Quality (JPEG quality, sharpness) |
Clarity
The clarity of the ad reflects the ease with which the ad text (the title or the description) can be understood by a reader. We measure clarity with several readability metrics (Flesch’s reading ease test, Flesch-Kincaid grade level, Gunning fog index, Coleman-Liau index, Laesbarheds index and RIX index). These metrics are defined using low-level text statistics, such as the number of words, the percentage of complex words, the number of sentences, number of acronyms, number of capitalized words and syllables per words. We also retain these low-level statistics.
Trustworthiness
Trustworthiness is the extent to which users perceive the ad as reliable. We represent this factor by analyzing different psychological reactions that users might experience when reading the ad text.
- Sentiment Incentives. Sentiment analysis tools automatically detect the overall contextual polarity of a text. To determine the polarity (positive, negative) of the ad sentiment, we analyze the ad title and description with SentiStrength, an open source sentiment analysis tool. We report two values, the probabilities (on a 5-scale grade) of the text sentiment being positive and negative, respectively.
- Psychological Incentives. The words used in the ad copy could have different psychological effects on users. To capture these, we resort to the LIWC 2007 dictionary, which associates psychological attributes to common words. We look at words categorized as social (e.g. talk, daughter, friend), affective (e.g. happy, worried, love, nasty), cognitive (e.g. think, because, should), perceptual (e.g. observe, listen, feel), biological (e.g. eat, flu, dish), personal concerns (words related to work, leisure, money) and finally relativity (words related to motion, space and time). For both the ad title and the description, we retain the frequency of the words that the LIWC dictionary associates with each of these 7 categories.
- Content Coherence. The consistency between ad title and ad description may also affect the ad trustworthiness. We capture this by calculating the similarity between the words in the ad title and ad description.
- Language Style. We analyze the degree of formality of the language in the ad, using a linguistic formality measure, which weights different types of words, with nouns, adjectives, articles and prepositions as positive elements, and adverbs, verbs and interjections as negative. We also include low-level features, such as the frequency of punctuation, numbers, “5W1H” words (e.g. What, Where, Why, When, Where, How), superlative adjectives or adverbs.
- Language Usage. We parse the text using Yahoo content analysis platform (CAP). From CAP, we get two scores. The spam score reflects the likelihood of a text to be of spamming nature. The hate speech score captures the extent to which any speech may suggest violence, intimidation or prejudicial action against/by a protected individual or group. We also extract a feature telling us whether the ad title is a click-bait. We also retain the frequency counts of words relating to slang and profanity.
Product/Service
Although quality is independent to relevance, some ad categories of ads might be considered lower quality (offensive) than others, and features may be more important for some types of product/service
- Text. To capture the product or service provided by the ad, we use Yahoo text-based classifier (YCT) that computes, given a text, a set of category scores (e.g. sports, entertainment) according to a topic taxonomy (only top-level categories). In addition, we calculate the adult score, as extracted from CAP, that suggests whether the product advertised is related to adult-related services such as dating websites.
- Image. To understand the content of the ad from a visual perspective, we tag the ad image with image classifiers, which automatically recognize the objects depicted in a picture (e.g. a person, a flower). For each of the detectable objects, the classifiers output a confidence score corresponding to the probability that the object is represented in the image. Since tag scores are very sparse (an image shows few objects), we group semantically similar tags into topically-coherent tag clusters (e.g. dog, cat will fall in the animal cluster). Examples of clusters include “plants”, “animals”. We also run an adult image detector, and retain the output confidence score as an indicator of the adultness of the ad creative.
We also extract deep-learning based features from the ad images. At this stage, it is not easy to interpret the visual attributes they are linked to (in terms of recommendations), thus we do not describe them. In the graph shown later, the top-50 discriminative deep-learning features are nonetheless shown for completeness (they are referred to as CNNObjectxxx).
Layout
- Text. Since the ad format of the native ads served on a given platform is fixed, we capture the textual layout of the ad creative by looking at the length of the ad text (e.g. number of sentences or words).
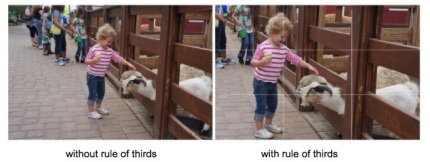
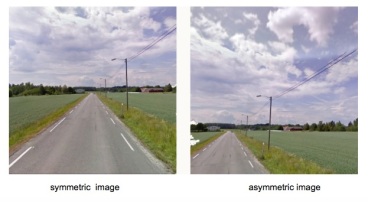
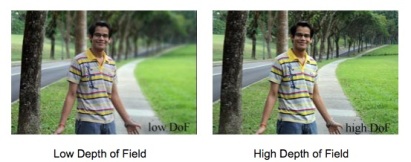
- Image. To quantify the composition of the ad image, we analyze the spatial layout in the scene using compositional visual features inspired by computational aesthetics research, a branch of computer vision that studies ways to automatically predict the beauty degree of images and videos. We compute a Symmetry descriptor based on the gradient difference between the left half of the image and its flipped right half. We then analyze whether the image follows the photographic Rule of Thirds, according to which important compositional elements of the picture should lie on four ideal lines (two horizontal and two vertical) that divide it into nine equal parts, using saliency distribution counts to detect the Object Presence. Finally, we look at the Depth of Field, which measures the ranges of distances from the observer that appear acceptably sharp in a scene, using wavelet coefficients. We also include an image text detector to capture whether the image contains text in it.
Aesthetic Appeal
To explore the contribution of visual aesthetics for ad quality, we also resort to computational aesthetics. We extract a total of 43 compositional features from the ad images.
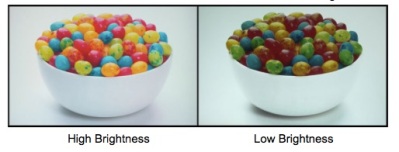
- Color. Color patterns are important cues to understand the aesthetic value of a picture. We first compute a luminance-based Contrast metric, which reflects the distinguishability of the image colors. We then extract the average Hue, Saturation, Brightness (H,S,V), by averaging HSV channels of the whole image and HSV values of the inner image quadrant. We then linearly combine average Saturation (S ̄) and Brightness (V ̄ ) values, and obtain three indicators of emotional responses, Pleasure, Arousal and Dominance. In addition, we quantize the HSV values into 12 Hue bins, 5 Saturation bins, and 3 Brightness bins and collect the pixel occurrences in the HSV Itten Color Histograms. Finally, we compute Itten Color Contrasts as the standard deviation of H, S and V Itten Color Histograms.
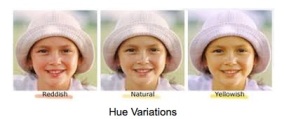

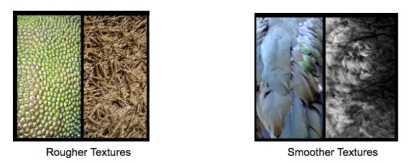
- Texture. To describe the overall complexity and homogeneity of the image texture, we extract the Haralick’s features from the Gray-Level Co-occurrence Matrices, namely the Entropy, Energy, Homogeneity, Contrast.
- Photographic Quality. These features describe the image quality and integrity. High-quality photographs are images where the degradation due to image post-processing or registration is not highly perceivable. To determine the perceived image degradation, we can use a set of simple image metrics originally designed for computational aesthetics, independent of the composition, the content, or its artistic value. These are:
Contrast Balance: We compute the contrast balance by taking the distance between the original image and its contrast-equalized version.

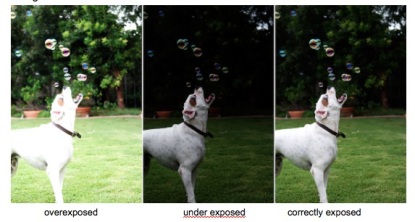
Exposure Balance: To capture over/under exposure, we compute the luminance histogram skewness.
JPEG Quality: When too strong, JPEG compression can cause disturbing blockiness effects. We compute here the objective quality measure for JPEG images.
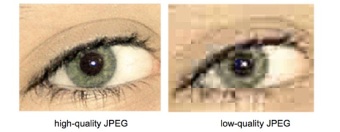
JPEG Blockiness: This detects the amount of ‘blockiness’ based on the difference between the image and its compressed version at low quality factor.
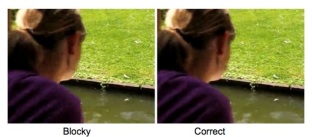
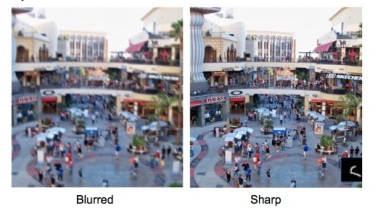
Sharpness: We detect the image sharpness by aggregating the edge strength after applying horizontal or vertical Sobel masks (Teengrad’s method).
Foreground Sharpness: We compute the Sharpness metric on salient image zones only.
Brand
We hypothesize that the intrinsic properties of the advertiser (such as the brand) have an effect of the user perception of ad quality. We use two features: domain pagerank and search volume. The domain pagerank is the pagerank score of the advertiser domain for a given ad landing page. An ad site with a high page rank is one that is linked to by many sites, hence reflecting a known brand. The search volume reflects the raw search volume of the advertiser within Yahoo search logs. This represents the overall popularity of the advertiser and its product/service.
Features importance
We focus on how the features listed above characterize the quality of an ad. To monitor ad quality, we exploit the information provided by the Yahoo ad feedback tool, namely ad offensiveness. Many Internet companies have put in place an a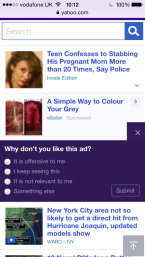 d feedback mechanisms, which give the users the possibility to provide negative feedback on the ads served. With the Yahoo ad feedback tool, a user can choose to hide an ad, and further select one of the following options as the reason for doing so: (a) It is offensive to me; (b) I keep seeing this; (c) It is not relevant to me; (d) Something else.
Among the many reasons why users may want to hide ads, marking one ad as offensive seems the most explicit indication of the quality of the ad.
We analyze the extent to which each feature individually correlates with offensive feedback rate (OFR). This is the number of time an ad has been marked as offensive divided by the number of time the ad was impressed. We report the correlation between each feature and OFR in the figure below (top-correlated features only). 1 means totally correlated, -1 means totally inversally correlated, whereas 0 means no correlation at all.

Correlation between ad copy features and offensive feedback rate
Some features are moderately positively correlated such as “Negative sentiment (Title)” with OFR whereas others are moderately negatively correlated such as “Image JPEG Quality”. This means that ad copy title with highly negative sentiment are more likely to be marked as offensive . Examples of such ads include those with words “hate” or “ugly” in them. Ad images with low quality JPEG are also more likely to be marked as offensive.
Overall we can see that features, such as
- visual features (e.g. JPEG compression artifacts, reflecting that high quality images are important),
- text features (e.g. whether the title contains negative sentiments, suggesting that although negative sentiments may attract clicks, they also offend users), and
- advertiser features (e.g. brand as measured with ad domain page rank, indicating that unknown brands are more likely to be marked as offensive by users.)
correlate with OFR. Interestingly, an ad title starting with a number is likely to belong to an offensive ad. Through manual inspection, we found that many offensive ads’ titles indeed tend to start with numbers, for example “10 most hated…”. Ad copy with lower image JPEG quality are often marked as offensive. A copy with less formal language and expressing negative sentiment in the ad titles are also often marked as offensive by users.
We used these features to build a prediction pre-click quality model, which aimed at predicting which ads will be marked as offensive by many users. Our model reaches an AUC of 0.77. We also deployed a model based on a subset of the above listed features on Yahoo news streams, which reduced the ad offensive feedback rate by 17.6% on mobile and 8.7% on desktop.
- K. Zhou, M. Redi, A. Haines and M. Lalmas. Predicting Pre-click Quality for Native Advertisements, 25th International World Wide Web Conference (WWW 2016), Montreal, Canada, April 11 to 15, 2016.
