Viewport time: From user engagement to user attention in online news reading
This is the first blog post on a paper that will be presented at WSDM 2016 [1], on metrics of user engagement using viewport time. This work is in collaboration with Dmitry Lagun, and was carried out while Dmitry was a student at Emory University, and as part of a Yahoo Faculty Research and Engagement Program.

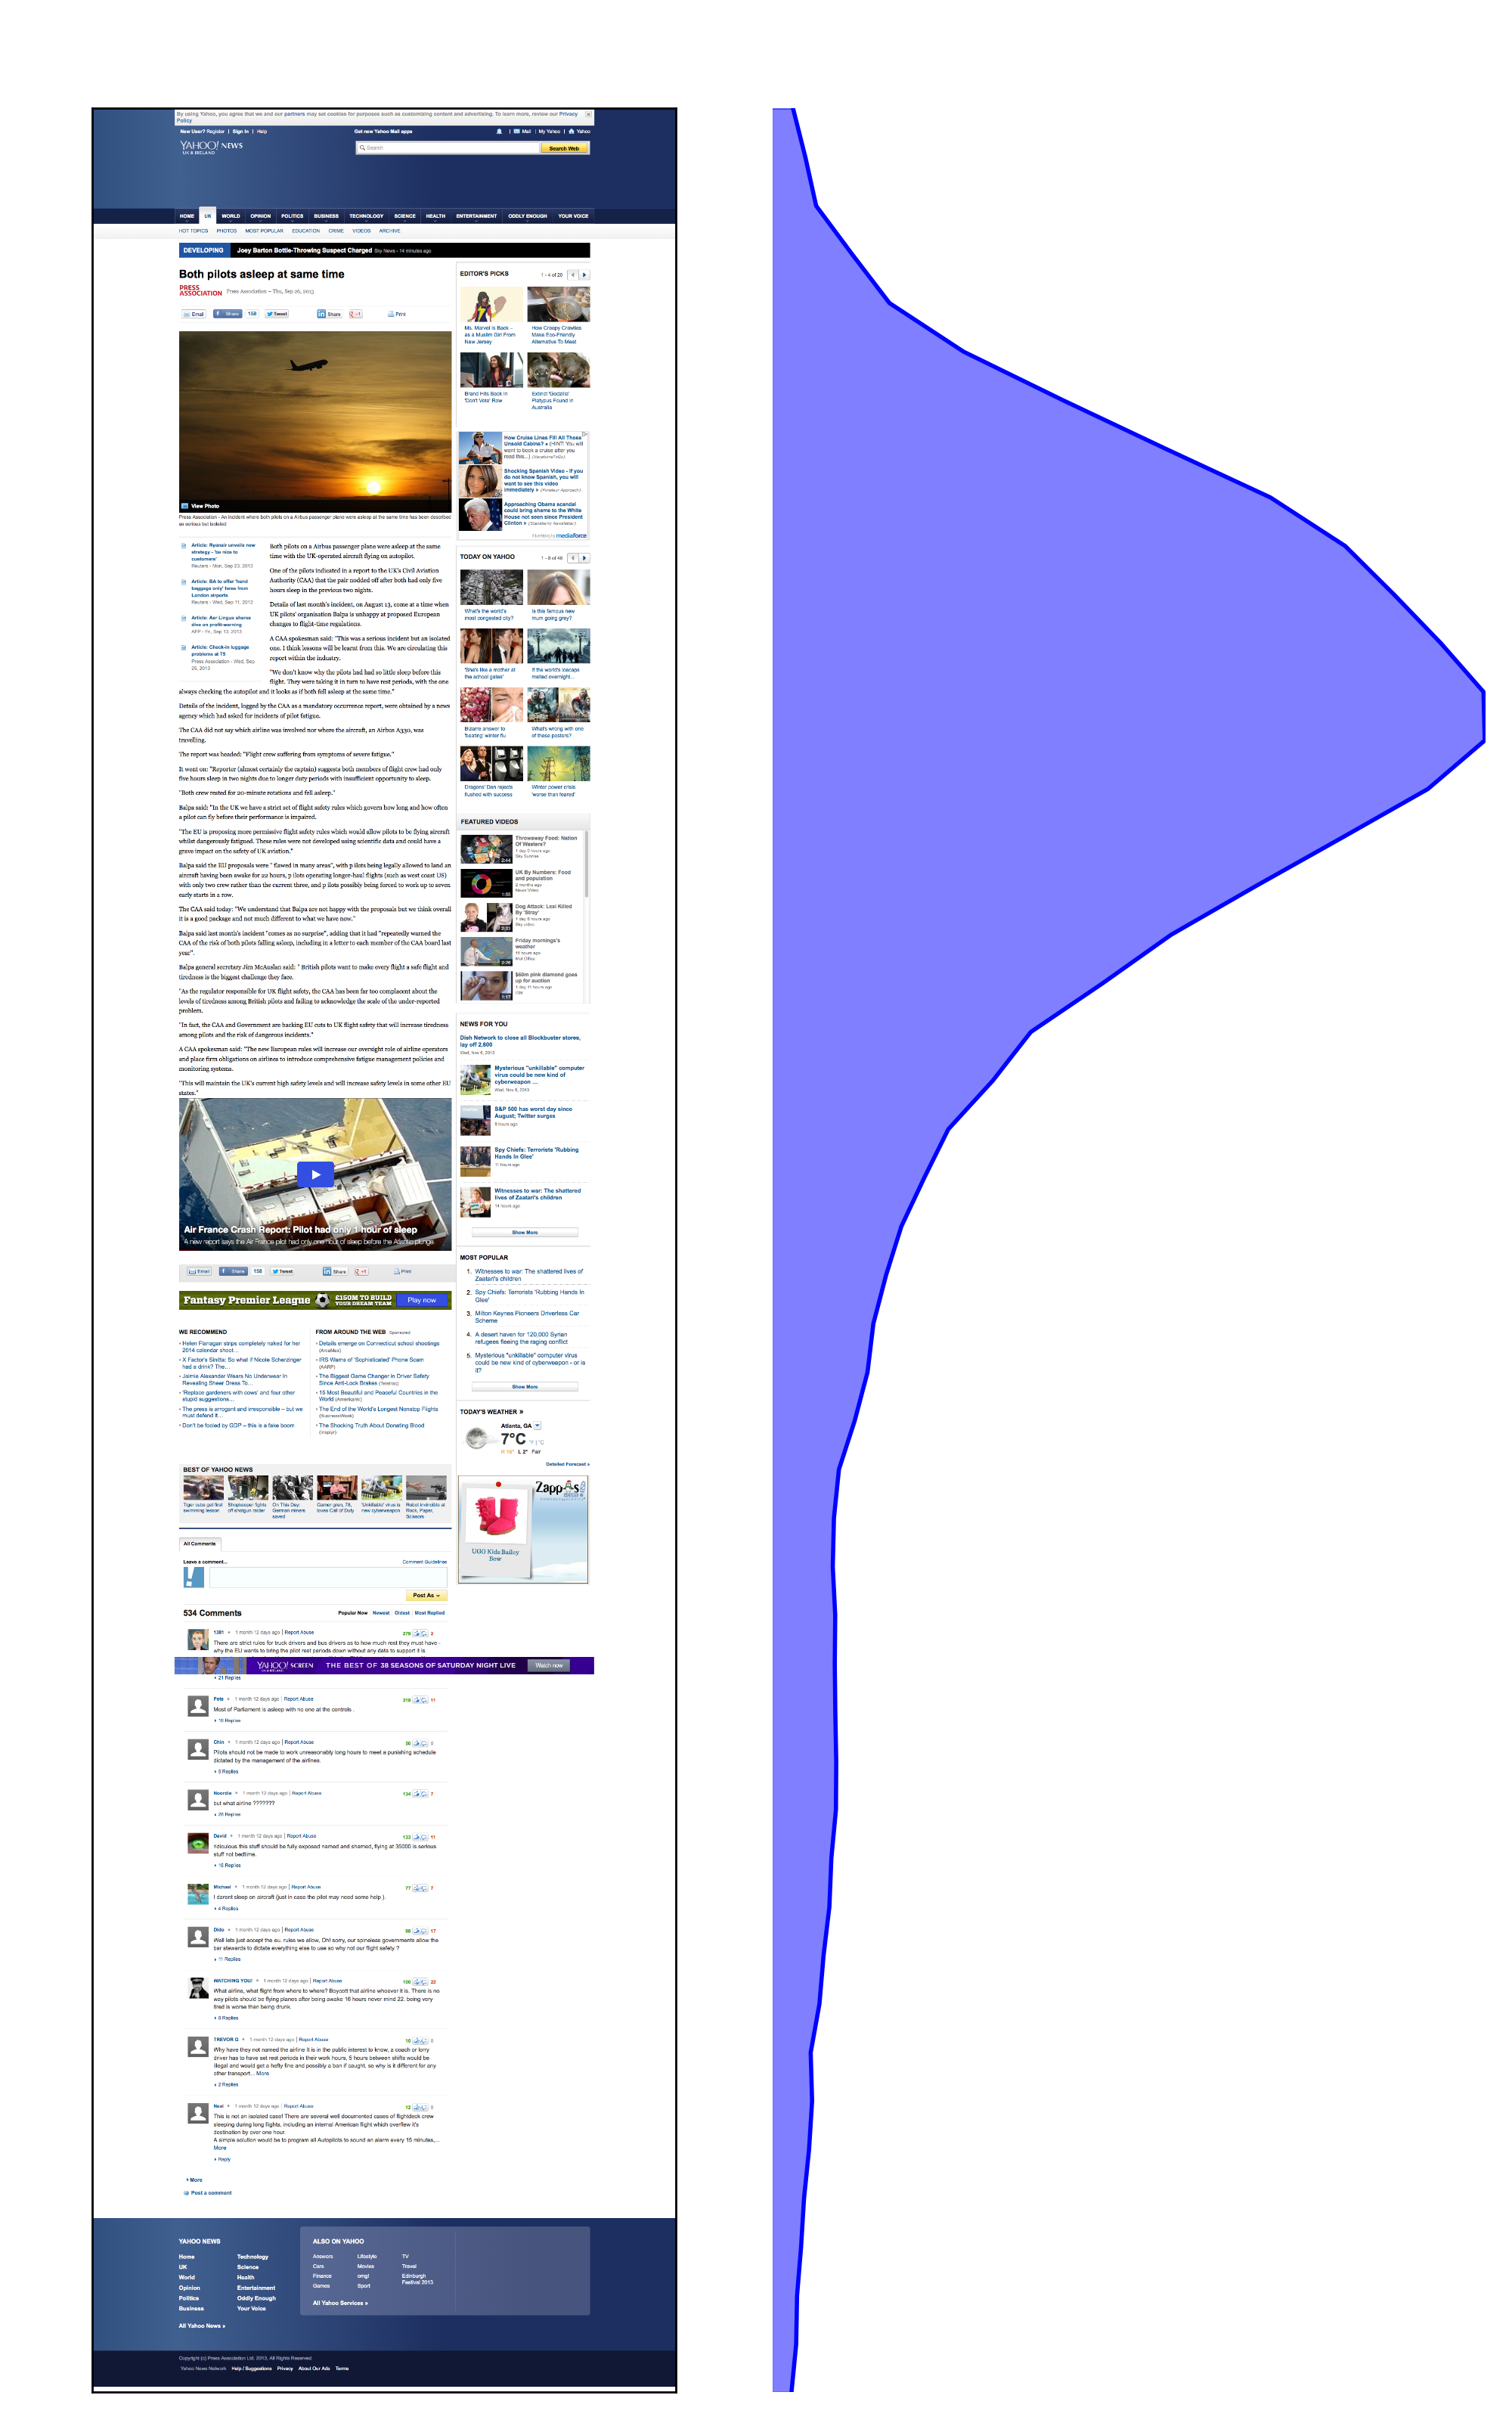
Figure 1 (a): Example page showing the most common pattern of user attention, where the reader attention decays monotonically towards the bottom of the article.

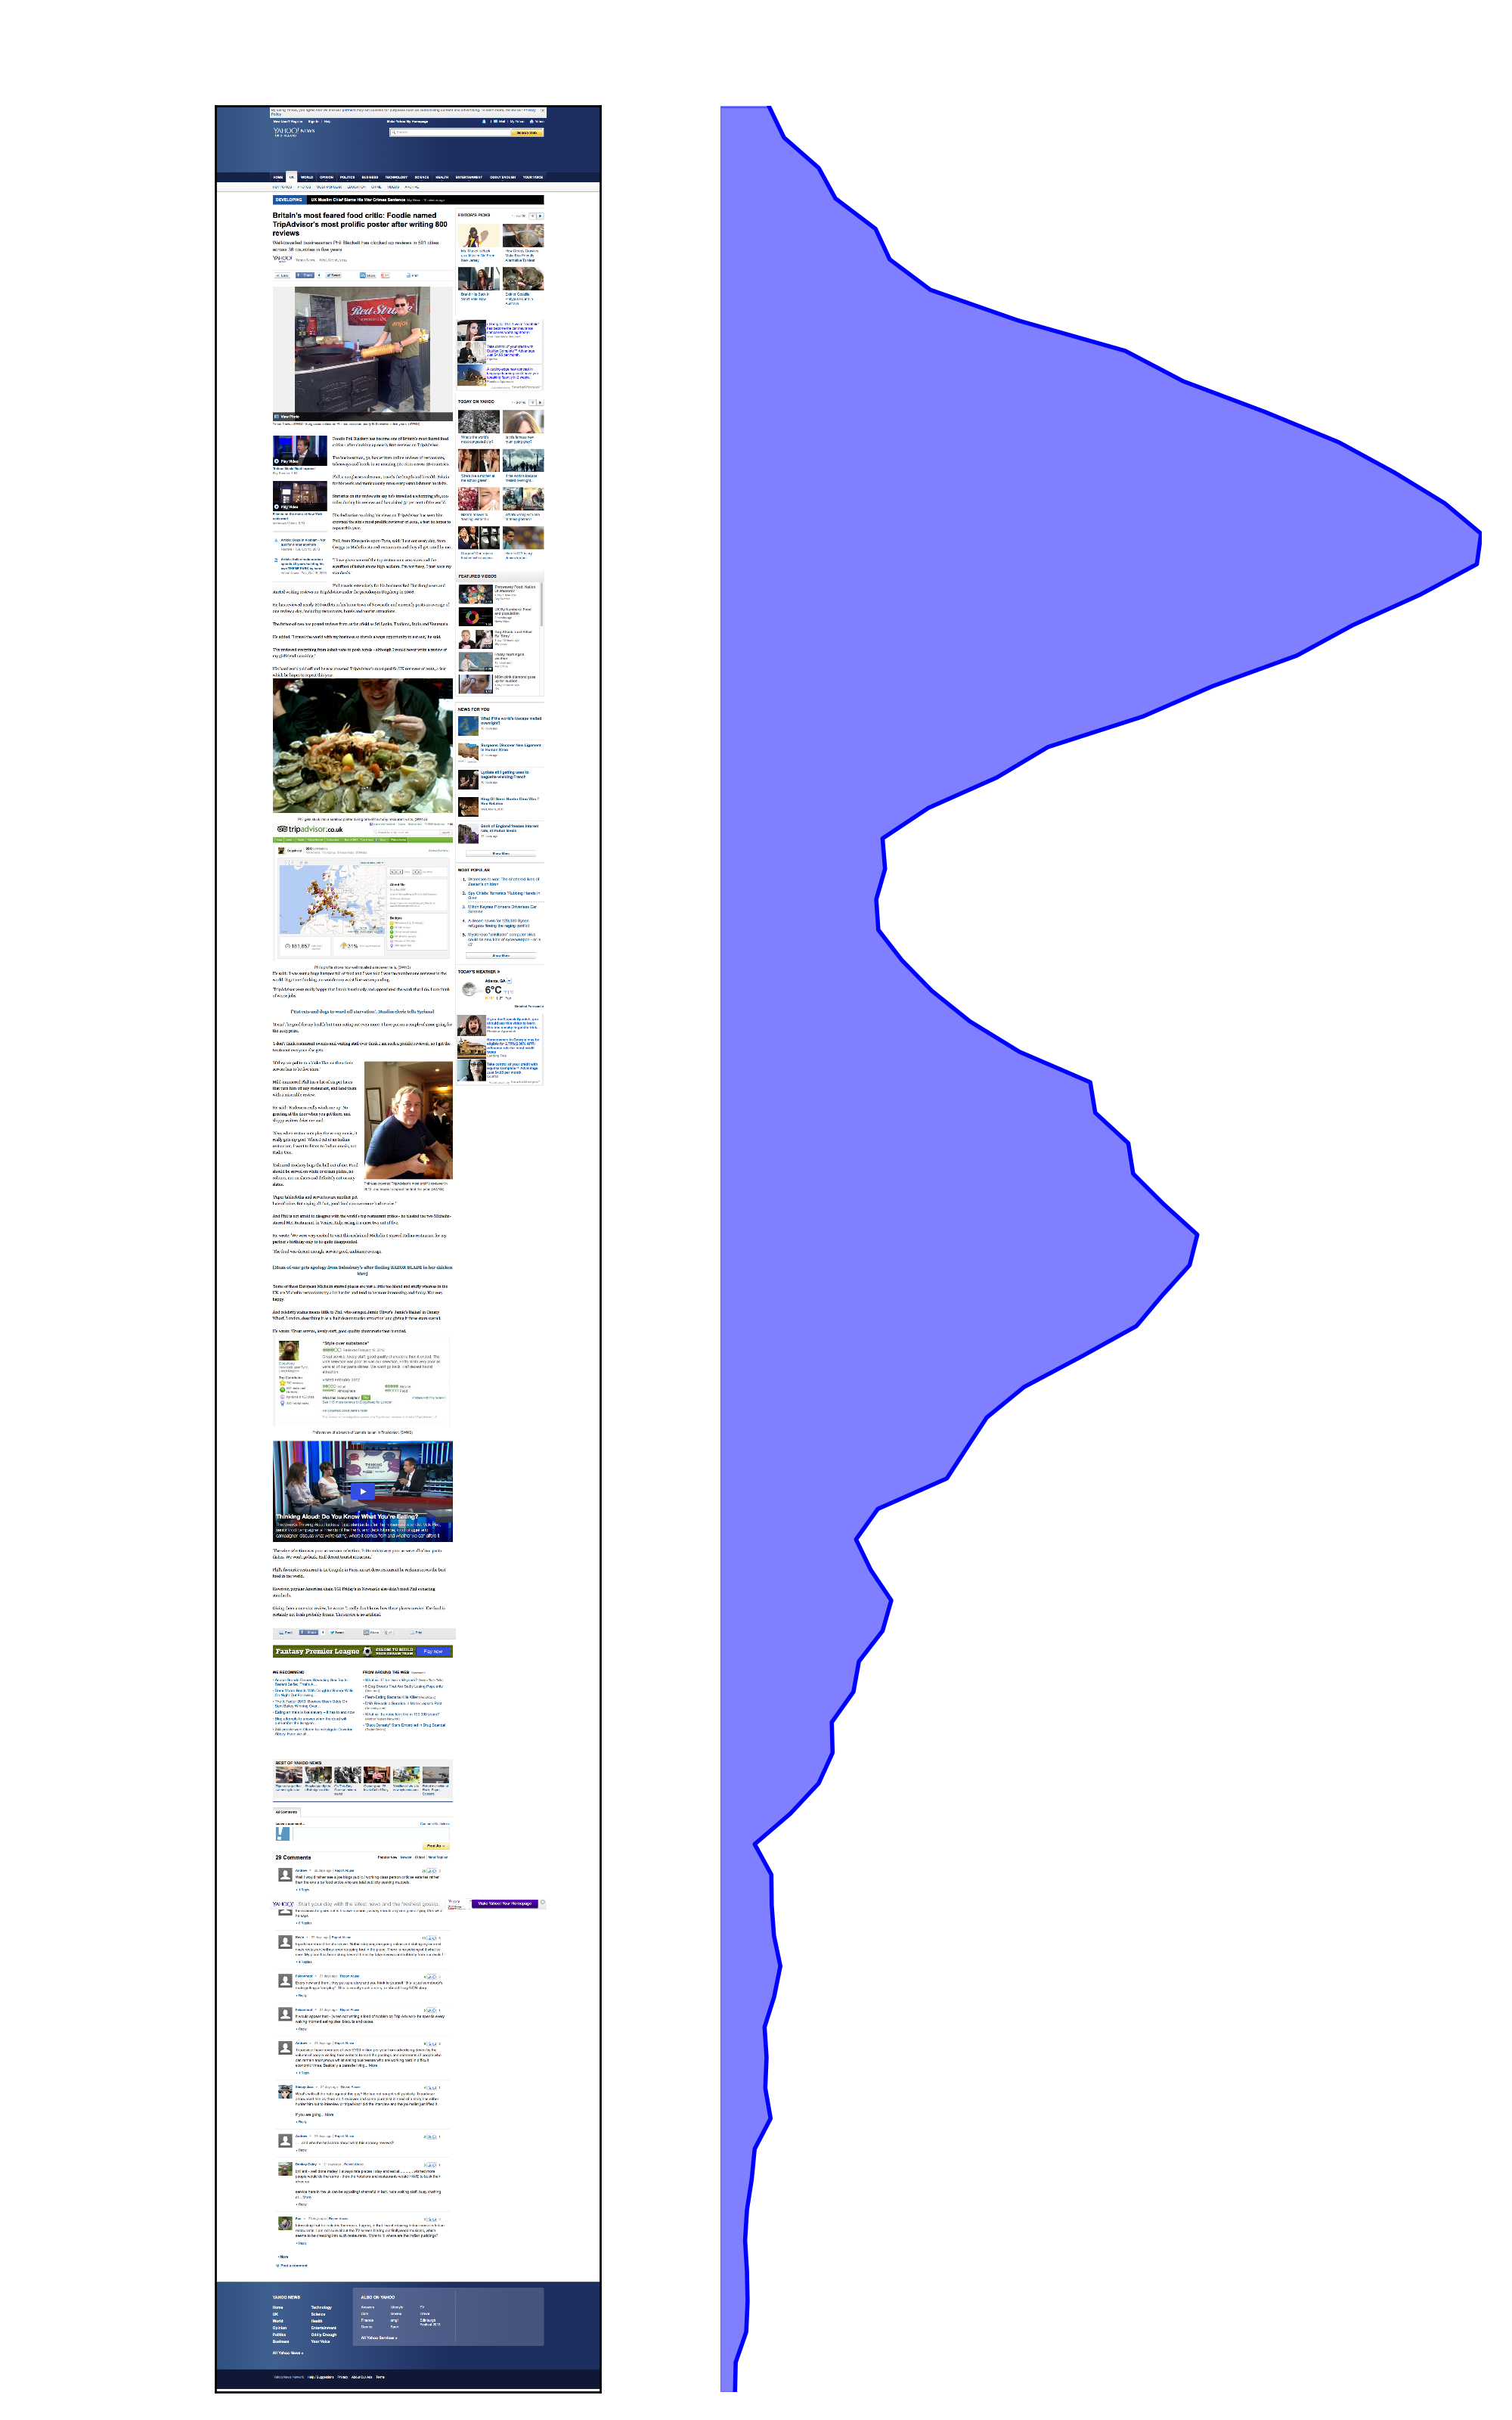
Figure 1 (b): Example page showing an unusual distribution of attention, indicating that content positioned closer to the end of the article attracts significant portion of user attention.
Online content providers such as news portals constantly seek to attract large shares of online attention by keeping their users engaged. A common challenge is to identify which aspects of the online interaction influence user engagement the most, so that users spend time on the content provider site. This component of engagement can be described as a combination of cognitive processes such as focused attention, affect and interest, traditionally measured using surveys. It is also measured through large-scale analytical metrics that assess users’ depth of interaction with the site. Dwell time, the time spent on a resource (for example a webpage or a web site) is one such metric, and has proven to be a meaningful and robust metric of user engagement in many contexts.
However, dwell time has limitations. Consider Figure 1 above, which shows examples of two webpages (news articles) of a major news portal, with associated distribution of time users spend at each vertical position of the article. The blue densities on the right side indicate the average amount of time users spent viewing a particular part of the article. We see two patterns:
In (a) users spend most of their time towards the top of the page, whereas in (b) users spend significant amount of time further down the page, likely reading and contributing comments to the news articles. Although the dwell time for (b) is likely to be higher (the data indeed shows this), it does not tell us much about user attention on the page, neither it allows us to differentiate between consumption patterns with similar dwell time values.
Many works have looked at the relationship between dwell time and properties of webpages, leading to the following results:
- A strong tendency to spend more time on interesting articles rather than on uninteresting ones.
- A very weak correlation between article length and associated reading times, indicating that most articles are only read in parts, not in their entirety. When these two correlate, they do so only to some extent, suggesting that users have a maximum time-budget to consume an article.
- The presence of videos and photos, the layout and textual features, and the readability of the webpage can influence the time users spend on a webpage.
However, dwell time does not capture where on the page users are focusing, namely the user attention. Hence, the suggestion of using other measurements to study user attention.
Studies of user attention using eye-tracking provided numerous insights about typical content examination strategies, such as top to bottom scanning of web search results. In the context of news reading, gaze is a reliable indicator of interestingness and correlates with self-reported engagement metrics, such as focused attention and affect. However, due to the high cost of eye-tracking studies, a considerable amount of research was devoted to finding more scalable methods of attention measurement, which would allow monitoring attention of online users at large scale. Mouse cursor tracking was proposed as a cheap alternative to eye-tracking. Mouse cursor position was shown to align with gaze position, when users perform a click or a pointing action in many search contexts, and to infer user interests in webpages. The ratio of mouse cursor movement to time spent on a webpage is also a good indicator of how interested users are in the webpage content, and cursor tracking can inform about whether users are attentive to certain content when reading it, and what their experience was.
However, despite promising results, the extent of coordination between gaze and mouse cursor depends on the user task e.g. text highlighting, pointing or clicking. Moreover, eye and cursor are poorly coordinated during cursor inactivity, hence limiting the utility of mouse cursor as an attention measurement tool in a news reading task, where minimal pointing is required. Thus, we propose to use instead viewport time to study user attention.
Viewport is defined as the position of the webpage that is visible at any given time to the user. Viewport time is the time a user spends viewing an article at a given viewport position.
Viewport time has been used as an implicit feedback information to improve search result ranking for subsequent search queries, to help eliminating position bias in search result examination, and to detect bad snippets and improve search result ranking in document summarization. Viewport time was also successfully used to infer user interest at sub-document level on mobile devices, and was helpful in evaluating rich informational results that may lack active user interaction, such as click.
Our work adds to this body of works, and explores viewport time, as a coarse, but more robust instrument to measure user attention during news reading.

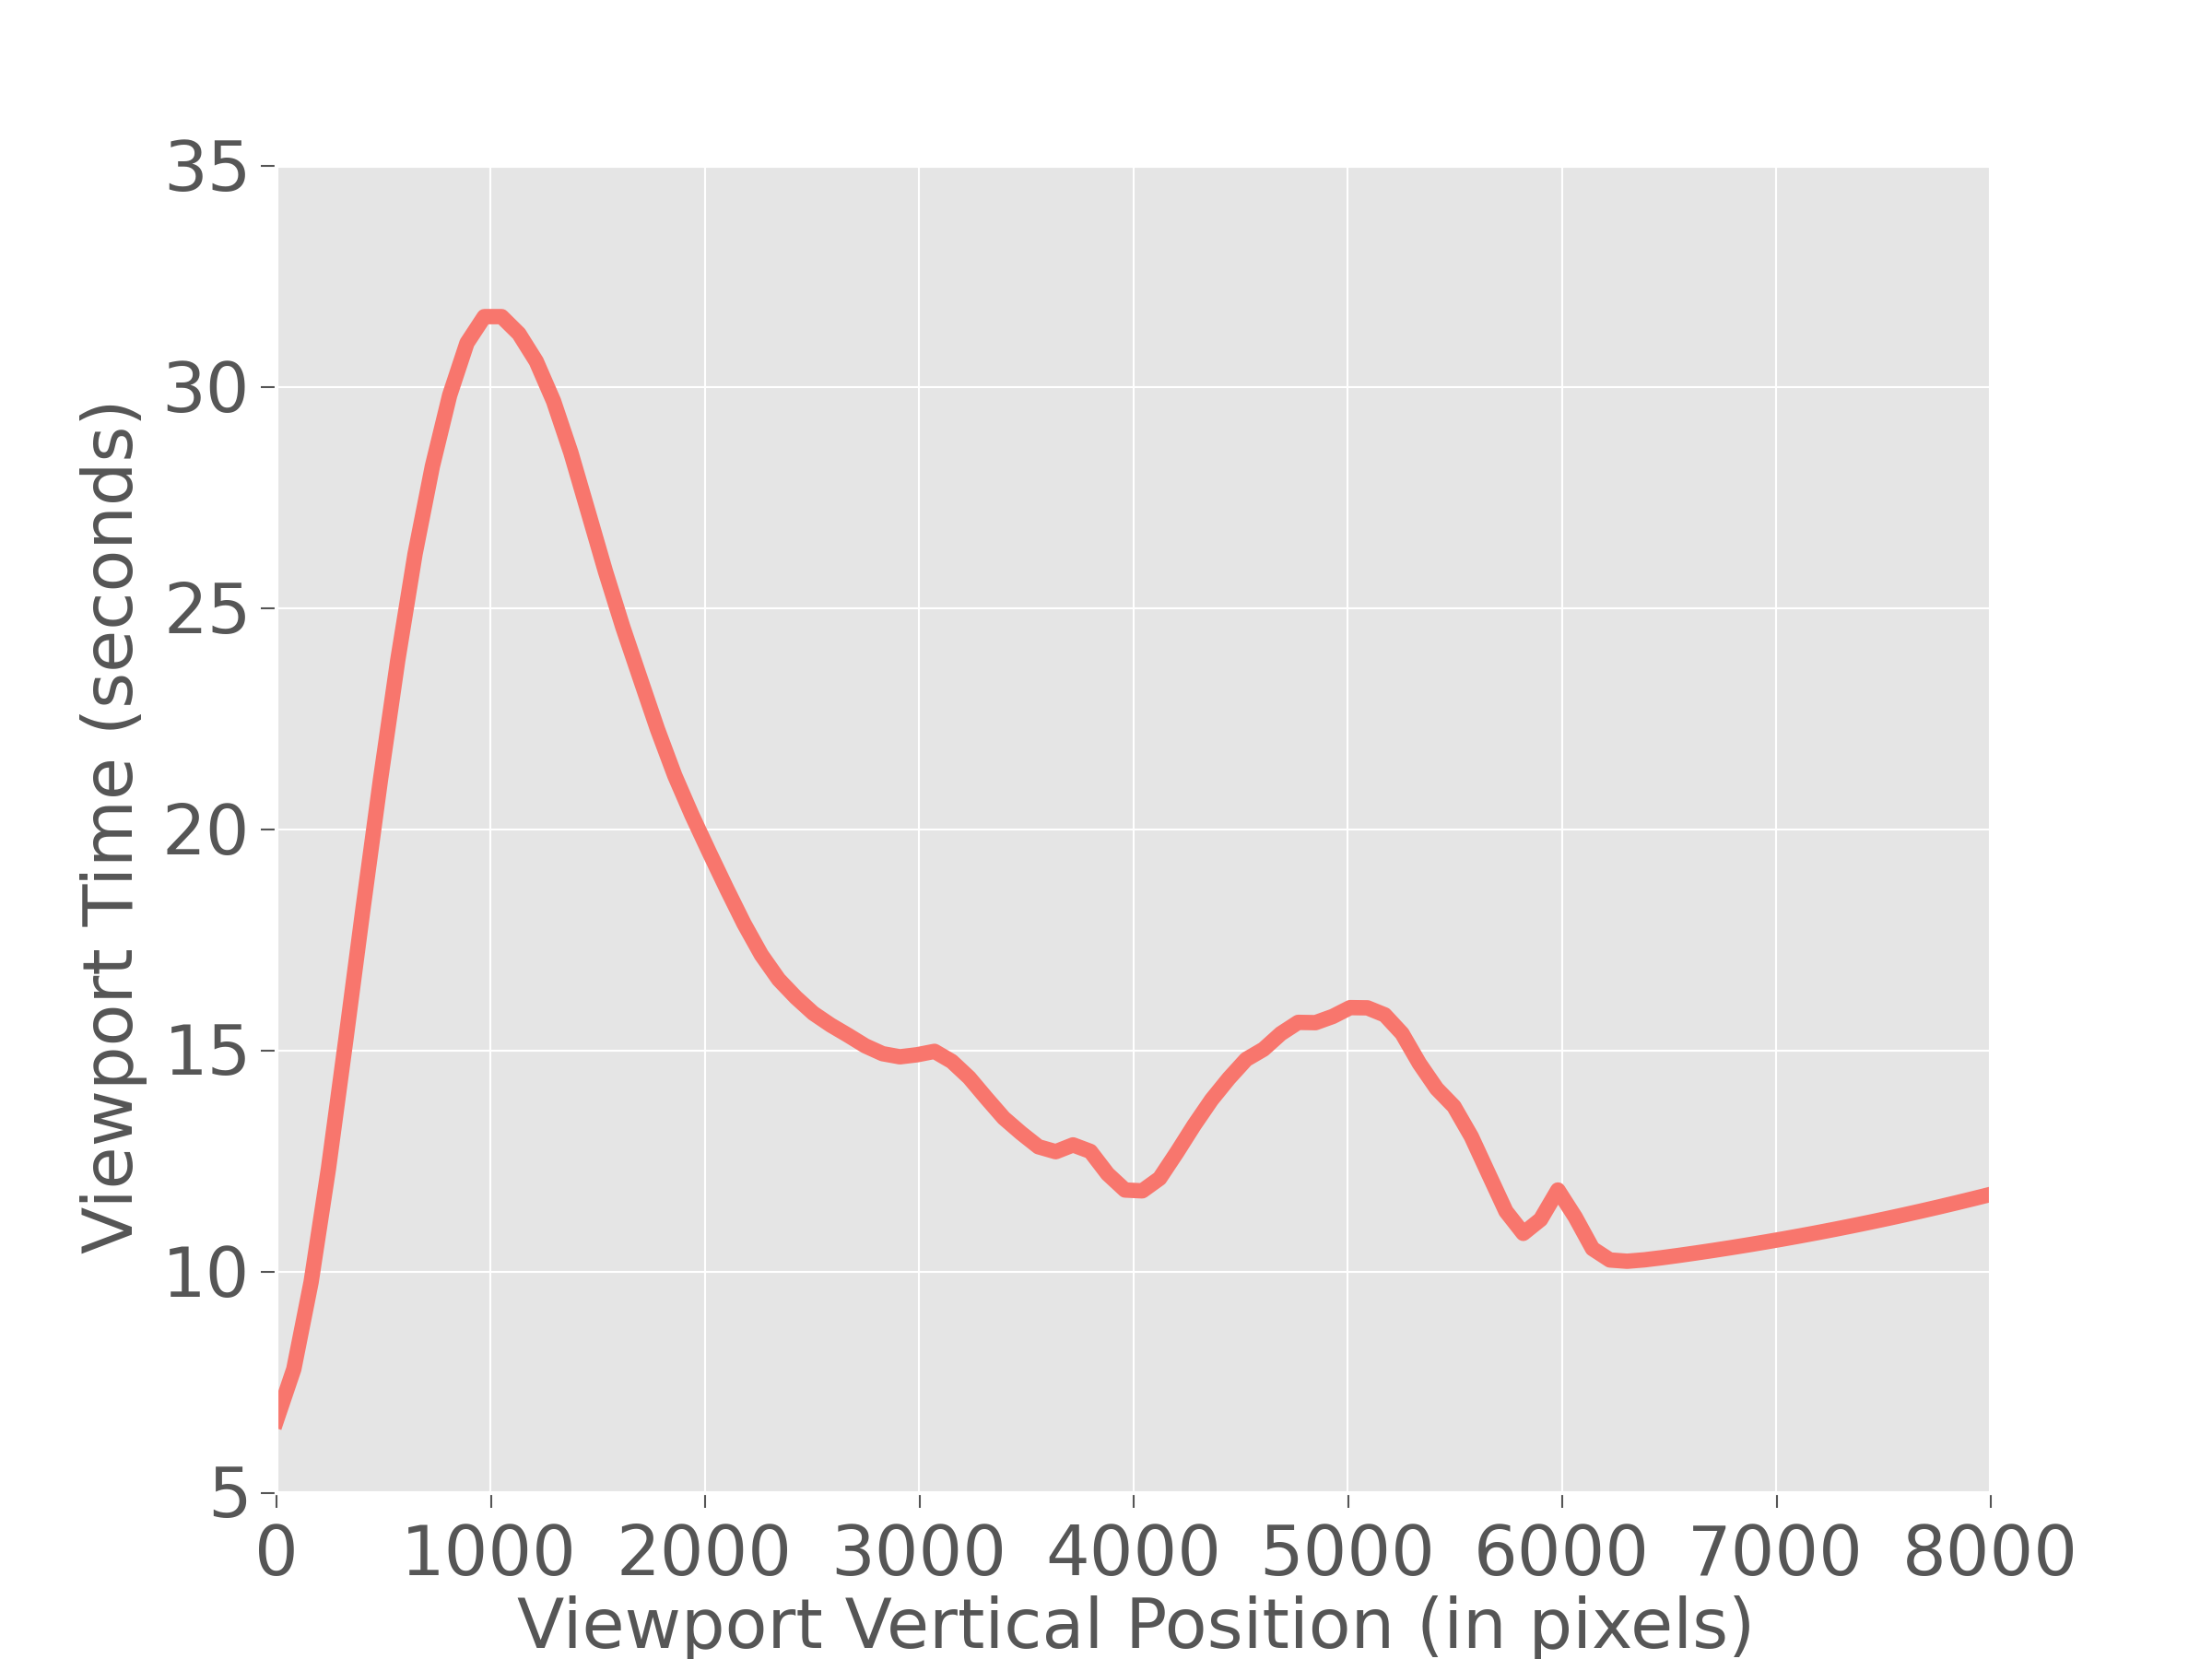
Figure 2. Distribution of viewport time averaged across all page views.
Figure 2 shows the viewport time distribution computed from all page views on a large sample of news articles. It has a bi-modal shape with the first peak occurring at approximately 1000 px and the second, less pronounced peak at 5000 px, suggesting that most page views have the viewport profile that falls between cases (a) and (b) of Figure 1. This also shows that on average user spends significantly smaller amount of time at lower scroll positions – the viewport time decays towards the bottom of the page. The fact that users spend substantially less time reading seemingly equivalent amount of text (top versus bottom of the article) may also explain the weak correlation between article length and the dwell time reported in several works.
Although users often remain in the upper part of an article, some users do find the article interesting enough to spend significant amount of time at the lower part of the article, and even to interact with the comments. Thus, some articles entice users to deeply engage with their content.
In this paper, we build upon this observation and employ viewport data to develop user engagement metrics that can measure to what extent the user interaction with a news article follows the signature of positive user engagement, i.e., users read most of the article and read/post/reply to a comment. We then develop a probabilistic model that accounts for both the extent of the engagement and the textual topic of the article. Through our experiments we demonstrate that such model is able to predict future level of user engagement with a news article significantly better than currently available methods.


 While reading news, users sometimes become interested in a particular news item they just read, and want to find more about it. They may want to obtain various angles on the story, for example, to overcome media bias or to confirm the veracity of what they are reading. News sites often provide information on different aspects or components of a story they are covering. They also link to other articles published by them, and sometims even to articles published by other news sites or sources. An example of an article having links to others is shown on the right, at the bottom of the article.

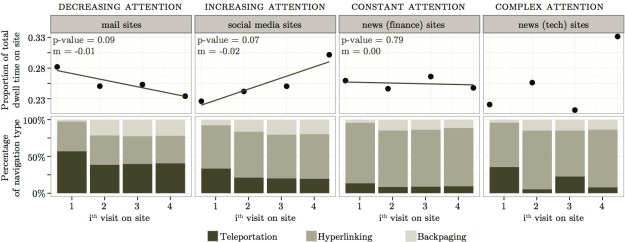
 We often access several sites within an online session. We may perform one main task (when we plan a holiday, we often compare offers from different travel sites, go to a review site to check hotels), or several totally unrelated tasks in parallel (responding to an email while reading news). Both are what we call online multitasking. We are interested in the extent to which multitasking occurs, and whether we can identify patterns.
 Recently, we were asked: “How engaged are Wikipedia users?” To answer this question, we visited
  We collected 13 months (September 2011 to September 2012) of browsing data from an anonymized sample of approximately 1.3M users. We identified 48 actions such as reading an article, editing, opening an account, donating, visiting a special page. We then built a weighted action network: nodes are the actions and two nodes are connected by an edge if the two corresponding actions were performed during the same visit to Wikipedia. Each node has a weight representing the number of users performing the corresponding action (the node traffic). Each edge has a weight representing the number of users that performed the two corresponding actions (the traffic between the two nodes).
 Two important events happened in our 13-month period. During the donation campaign (November to December 2011) more users visited Wikipedia (higher TotalNodeTraffic value). We speculate that many users became interested in Wikipedia during the campaign. However, because TotalTrafficRecirculation actually decreased for the same period, although more users visited Wikipedia, they did not perform two (or more) actions while visiting Wikiepedia; they did not become more engaged with Wikipedia. However, during the SOPA/PIPA protest (January 2012), we see a peak in TotalNodeTraffic and TotalTrafficRecirculation. More users visited Wikipedia and many users became more engaged with Wikipedia; they also read articles, gathered information about the protest, donated money while visiting Wikipedia.
 We detected different engagement patterns on weekdays and weekends. Whereas more users visited Wikipedia during weekdays (high value of TotalNodeTraffic), users that visited Wikipedia during the weekend were more engaged (high value of TotalTrafficRecirculation). On weekends, users performed more actions during their visits.
![meaganmakes - 182-365+1 [cc] - 2](https://mounia-lalmas.blog/wp-content/uploads/2013/09/meaganmakes-182-3651-cc-2.png?w=300&h=225) So which actions became more frequent as a result of the donation campaign? As expected, we observed a significant traffic increase on the “donate” node during the two months; many users made a donation. In addition, the traffic from some nodes to other nodes increased but only slightly. Additional actions were performed; for instance, more users created a user account, visited community-related pages, all within the same session. However, overall, users mostly performed individual actions since TotalTrafficRecirculation decreased during that time period.
So which actions became more frequent as a result of the donation campaign? As expected, we observed a significant traffic increase on the “donate” node during the two months; many users made a donation. In addition, the traffic from some nodes to other nodes increased but only slightly. Additional actions were performed; for instance, more users created a user account, visited community-related pages, all within the same session. However, overall, users mostly performed individual actions since TotalTrafficRecirculation decreased during that time period. I recently attended the
  Common measurements include:
