What can absence time tell about user engagement?
Two widely employed engagement metrics are click-through rate and dwell time. These are particularly used for services where user engagement is about clicking, for example in the context of search where presumably users click on relevant results, and/or spending time on a site, for example consuming content in the context of a news portal.
In search, both have been used as indicator of relevance, and have been exploited to infer user satisfaction with their search results and improve ranking functions. However, how to properly interpret the relations between these metrics, retrieval quality and the long-term user engagement with the search application is not straightforward. Also, relying solely on clicks and time spent can lead to contradictory if not erroneous conclusions. Indeed, with the current trend of displaying rich information on web pages, for instance the phone number of restaurants or weather data in search results, users do not need to click to access the information and the time spent on a website is shorter.
 Measure: Absence time
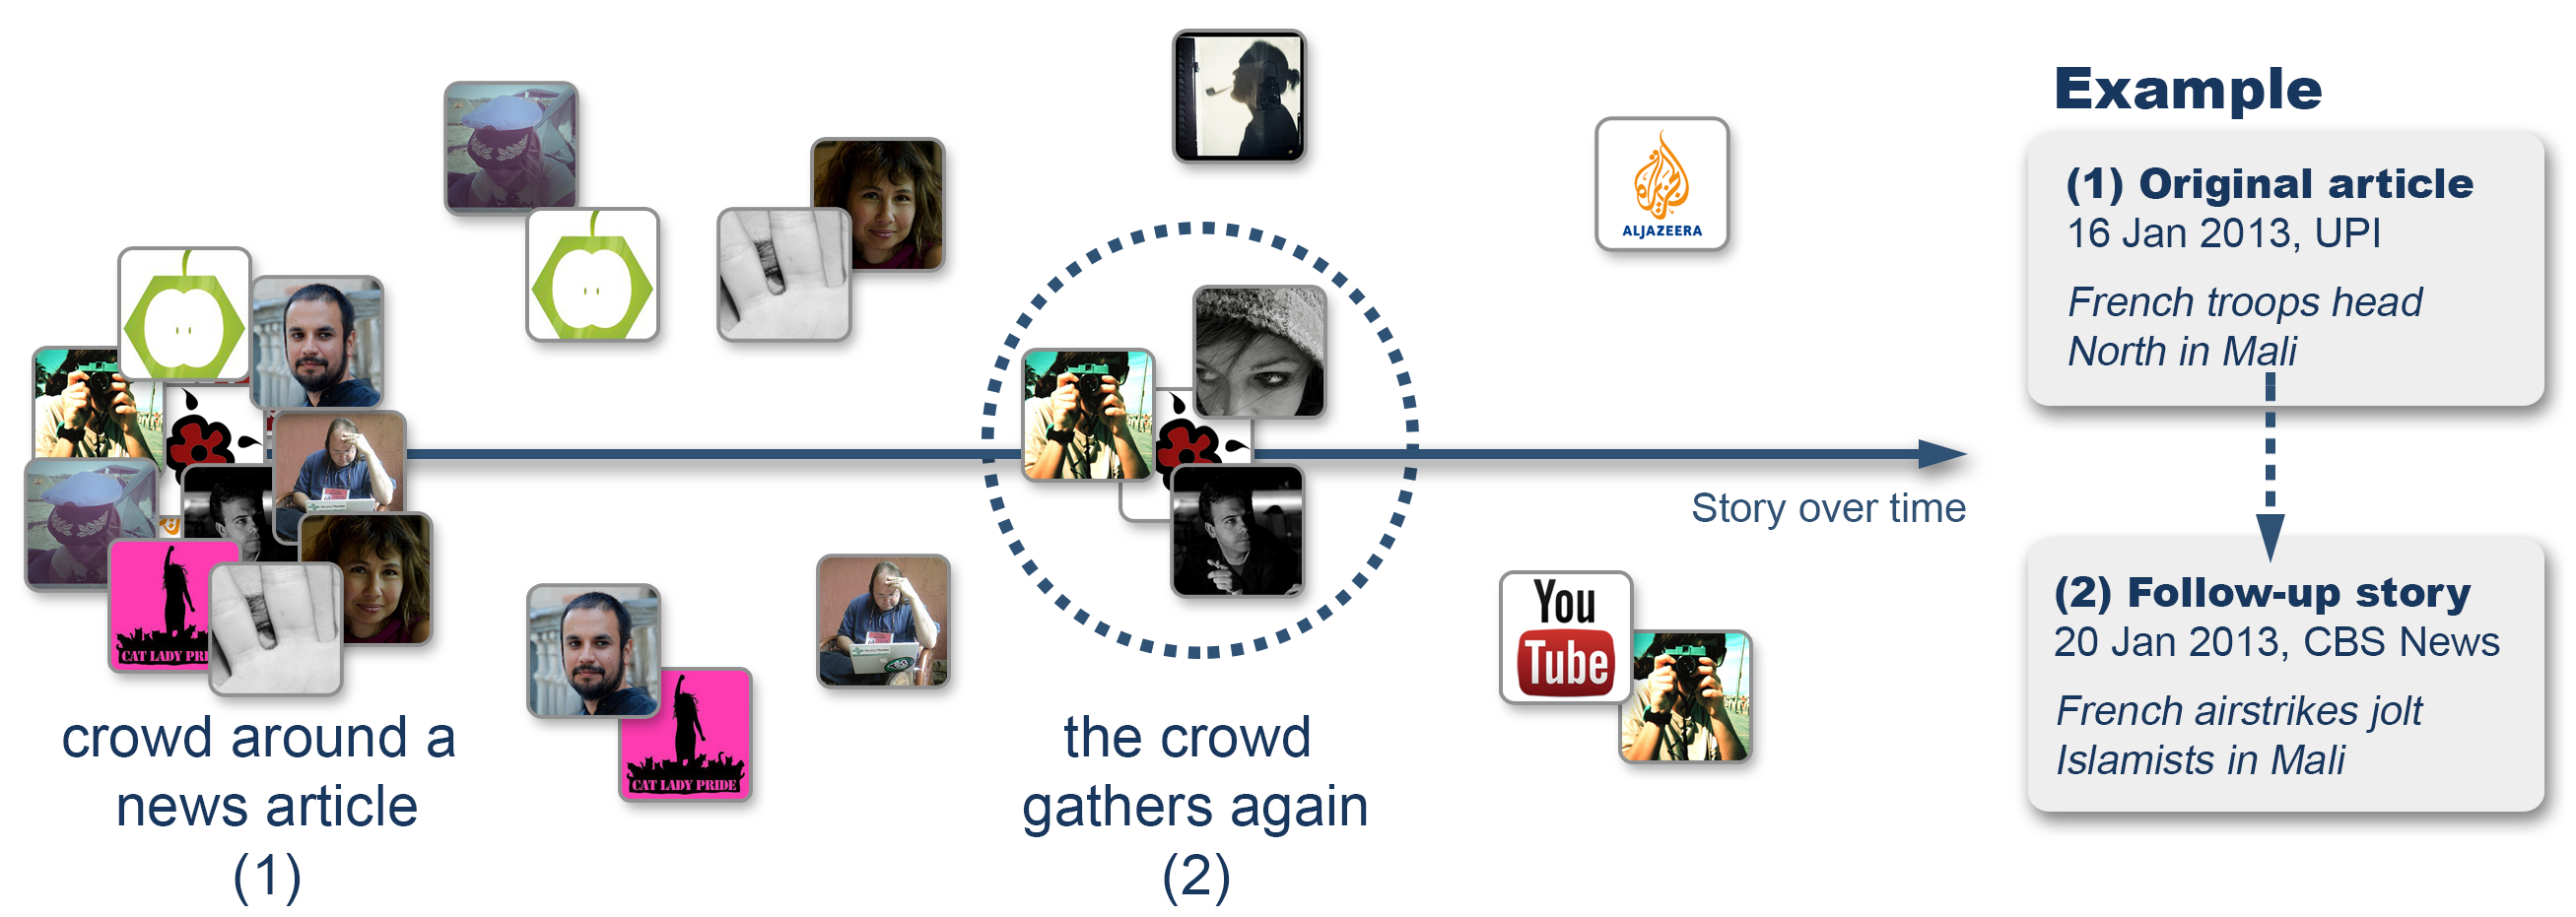
The absence time measures the time it takes a user to decide to return to a site to accomplish a new task. Taking a news site as an example, a good experience associated with quality articles might motivate the user to come back to that news site on a regular basis. On the other hand, if the user is disappointed, for example, the articles were not interesting, the site was confusing, he or she may return less often and even switch to an alternative news provider. Another example is a visit to a community questions and answers website. If the questions of a user are well and promptly answered, the odds are that he or she will be enticed to raise new questions and return to the site soon.
Our assumption is that if users find a site interesting, engaging or useful, they will return to it sooner.
This assumption has the advantage of being simple, intuitive and applicable to a large number of settings.
Case study: Yahoo! Answers Japan
We used a popular community querying and answering website hosted by Yahoo! Japan, where users are given the possibility to ask questions about any topic of their interest. Other users may respond by writing an answer. These answers are recorded and can be searched by any user through a standard search interface. We studied the actions of approximately one million users during two weeks. A user action happens every time a user interacts with Yahoo! Answers: every time he or she issues a query or clicks on a link, be it an answer, an ad or a navigation button. We compare the behaviour of users exposed to six functions used to rank past answers both in term of traditional metrics and of absence time.
Methodology: Survival analysis
We use Survival Analysis to study absence time. Survival Analysis has been used in applications concerned with the death of biological organisms, each receiving different treatments. An example is throat cancer treatment where patients are administered one of several drugs and the practitioner is interested in seeing how effective the different treatments are. The analogy with our analysis of absence time is unfortunate but nevertheless useful. We associate the user exposition to one of the ranking functions as a “treatment” and his or her survival time as the absence time. In other words, a Yahoo! Answers user dies each time he or she visits the site … but hopefully resuscitates instantly as soon as his or her visit ends.
Survival analysis makes uses of a hazard rate, which reflects the probability that a user dies at a given time. It can be very loosely understood as the speed of death of a population of patients at that time. Returning to our example, if the hazard rate of throat cancer patients administered with say drug A is higher than the hazard rate of patients under drug B treatment, then drug B patients have a higher probability of surviving until that time. A higher hazard rate implies a lower survival rate.
We use hazard rates to compare the different ranking functions for Yahoo! Answers: a higher hazard rate translates into a short absence time and a prompter return to Yahoo! Answers, which is a sign of higher engagement. What did we find?
A better ranking does not imply more engaged users
Ranking algorithms are compared with a number of measures; a widely used one is DCG, which rewards ranking algorithms retrieving relevant results at high ranks. The higher the DCG, the better the ranking algorithm. We saw that, for the six ranking functions we compared, a higher DCG did not always translate to a higher hazard rate, or in other words, users returning to Yahoo! Answers sooner.
Returning relevant results is important, but is not the only criterion to keep users engaged with the search application.
More clicks is not always good, but no click is bad
A common assumption is that a higher number of clicks is a reflection of a higher user satisfaction with the search results. We observe that up to 5 clicks, each new click is associated with a higher hazard rate, but the increases from the third click are small. A fourth or fifth click has a very similar hazard rate. From the sixth click, the hazard rates decreases slowly.
This suggests that on average, clicks after the fifth one reflect a poorer user experience; users cannot find the information they are looking for.
We also observed that the hazard rate with five clicks or more is always higher compared with no click at all; when users search on Yahoo! Answers, no click means a bad user experience.
A click at rank 3 is better than a click at rank 1
The hazard rate is larger for clicks at ranks 2, 3 and 4, the maximum arising at rank 3, when compared to click at rank 1. For lower ranks, the trend is toward decreasing hazard. Only the click at rank 10 was found to be clearly less valuable than a click at rank 1. It seems that users unhappy with results at earlier ranks simply click on the last displayed result, for no apparent reason apart for it being the last one on the search result page.
Clicking lower in the ranking suggests a more careful choice from the user, while clicking at the bottom is a sign that the overall ranking is of low quality.
Clicking fast on a result is a good sign
We found that the shorter the time between the search results of a query being displayed and the first click, the higher the hazard rate.
Users who find their answers quickly return sooner to the search application.
More views is worst that more queries
When users are returned search results, they may click on a result, then return back to the search result page, and then click on another result. Each display of search results generates a view. At anytime, the user may submit a new query. Both returning to the search result page several times and a higher number of query reformulations are signs that the user is not satisfied with the current search results. Which one is worse? We could see that having more views than queries was associated on average with a low hazard rate, meaning a longer absence time.
This suggests that returning to the same search result page is a worse user experience than reformulating the query.
Without the absence time, it would have been harder to observe this, unless we asked explicitly the users to tell us what is going on.
 A small warning
A user might decide to return sooner or later to a website due to reasons unrelated with the previous visits (being on holidays for example). It is important to have a large sample of interaction data to detect coherent signals and to take systematic effects into account.
Take away message
Using absence time to measure user engagement is easy to interpret and less ambiguous than many of the commonly employed metrics. Use it and get new insights with it.
This work was done in collaboration with Georges Dupret. More details about the study can be found in Absence time and user engagement: Evaluating Ranking Functions, which was published at the 6th ACM International Conference on Web Search and Data Mining in Rome, 2013.
Photo credits: tanfelisa and kaniths (Creative Commons BY).

 I recently attended the Input-Output conference in Brighton, UK. The theme of the conference was “Interdisciplinary approaches to Causality in Engagement, Immersion, and Presence in Performance and Human-Computer Interaction”. I wanted to learn about psychophysiological measurement.
 Common measurements include:

 What did we do?
  … So what now?