Online, users multitask

screenshot multitaskingWe often access several sites within an online session. We may perform one main task (when we plan a holiday, we often compare offers from different travel sites, go to a review site to check hotels), or several totally unrelated tasks in parallel (responding to an email while reading news). Both are what we call online multitasking. We are interested in the extent to which multitasking occurs, and whether we can identify patterns.

Our dataset

Our dataset consists of one month of anonymised interaction data from a sample of 2.5 millions users who gave their consent to provide browsing data through a toolbar. We selected 760 sites, which we categorised according to the type of services they offer. Examples of services include mail, news, social network, shopping, search, and sometimes cater to different audiences (for example, news about sport, tech and finance). Our dataset contains 41 million sessions, where a session ends if more than 30 minutes have elapsed between two successive page views. Finally, continuous page views of the same site are merged to form a site visit.

How much multitasking in a session?

On average, 10.20 distinct sites are visited within a session, and for 22% of the visits the site was accessed previously during the session. More sites are visited and revisited as the session length increases. Short sessions have on average 3.01 distinct sites with a revisitation rate of 0.10. By contrast, long sessions have on average 9.62 different visited sites with a revisitation rate of 0.22.

We focus on four categories of sites: news (finance), news (tech), social media, and mail. We extract for each category a random sample of 10,000 sessions. As shown in Figure 1 below, the sites with the highest number of visits within a session belong to the social media category (average of 2.28), whereas news (tech) sites are the least revisited sites (average of 1.76). The other two categories have on average 2.09 visits per session.

Visits and absence time
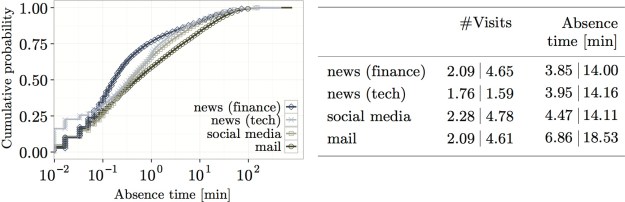
Figure 1: Site visit characteristics for four categories of sites: (Left) Distribution of time between visits; and (Right) Average and standard deviation of number of visits and time between visits.

What happens between the visits to a site?

We call  the time between visits to a site within the session absence time. We see three main patterns with the four categories of sites, as shown in Figure 1 above (right):

  • social media sites and news (tech) sites have an average absence time of 4.47 minutes and 3.95 minutes, respectively, although the distributions are similar;
  • news (finance) sites have a skewer distribution, indicating a higher proportion of short absence time for sites in this category;
  • mail sites have the highest absence time, 6.86 minutes on average.

However, the media of the distributions of the absence time across all categories of sites is less than 1 minute, and this for all categories. That is, many sites are revisited after a short break. We speculate that a short break corresponds to an interruption of the task being performed by the user (on the site), whereas a longer break indicates that the user is returning to the site to perform a new task.

How do users switch between sites?

Users can switch between sites in several ways:

  1. hyperlinking: clicking on a link,
  2. teleporting: jumping to a page using bookmarks or typing an URL,  or
  3. backpaging: using the back button on the browser, or when several tabs or windows are ope and the user returns to one of them).

The way users revisit sites varies depending on the session length. Teleporting and hyperlinking are the most important mechanisms to re-access a site during short sessions (30% teleporting and 52% hyperlinking for short sessions), whereas backpaging becomes more predominant in longer sessions. Tabs or the back button are often used to revisit a site.

Patterns of multitasking
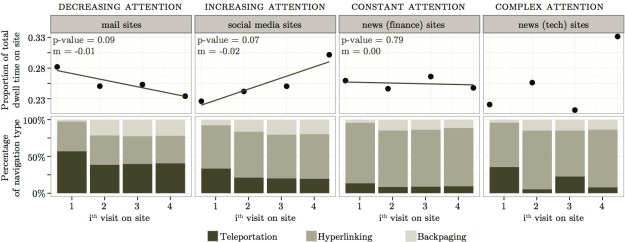
Figure 2: (Top) Visit patterns described by the average time spent on the site at the ith visit in a session. (Bottom) Usage of navigation types described by the proportion of each navigation type at the ith visit in a session.

We also look at how users access a site at each revisit, for the four categories of sites. This is shown in Figure 2 (bottom).

  • For all four categories of sites, the first visit is often through teleportation. Accessing a site in this manner indicates a high level of engagement, in particular in terms of loyalty, with the site, since users are likely to have bookmarked the site at some previous interaction with it. In our dataset, teleportation is more frequently used to access news (tech) sites than news (finance) sites.
  • After the first visit, backpaging is increasingly used to access a site. This is an indication that users leave the site by opening a new tab or window, and then return to the site later to continue whatever they were doing on the site.
  • However, in general, users still revisit a site mostly through hyperlinking, suggesting that links still have an important role in directing users to a site. In our dataset, news (finance) sites are mostly accessed through links; users are directed to sites of this category via a link.

Time spent at each revisit

For each site, we select all sessions where the site was visited at least four times. We see four main patterns, which are shown in Figure 2 (top):

  • The time spent on social media sites increases at each revisit (a case of increased attention). The opposite is observed for mail sites (a case of decreased attention). A possible explanation is that, for mail sites, there are less messages to read in subsequent visits, whereas for social media sites, users have more time to spend on them eventually because the other tasks they were doing are getting finished.
  • News (finance) is an example of category for which neither a lower or higher dwell time is observed at each subsequent revisit (a case of constant attention). We hypothesise that each visit corresponds either to a new task or a user following some evolving piece of information such as checking the latest stock price figures.
  • The time spent on news (tech) sites at each revisit is fluctuating. Either no patterns exist or the pattern is complex, and cannot easily be described (a case of complex attention). However, when looking at the first two visits or the last two visits, in both cases, more time is spent in each second visit. This may indicate that the visits belong to two different tasks, and each task is performed in two distinct visits to the site. Teleportation is more frequent at the 1st and 3rd visits, which confirms this hypothesis (Figure 2, bottom).

Take away message

Multitasking exists, as many sites are visited and revisited during a session. Multitasking influences the way users access sites, and this depends on the type of site.

This work was done in collaboration with Janette Lehmann, Georges Dupret and Ricardo Baeza-Yates. More details about the study can be found in  Online Multitasking and User Engagement, ACM International Conference on Information and Knowledge Management (CIKM 2013), 27 October – 1 November 2013, San Francisco, USA.

Photo credits: D&D (Creative Commons BY).

How engaged are Wikipedia users?

Wikipedia Recently, we were asked: “How engaged are Wikipedia users?” To answer this question, we visited Alexa, a Web Analytics site, and learned that Wikipedia is one of the most visited sites in the world (ranked 6th), that users spend on average around 4:35 minutes per day on Wikipedia, and that many visits to Wikipedia come from search engines (43%). We also found studies about readers’ preferences, Wikipedia growth, and Wikipedia editors. There is however little about how users engage with Wikipedia, in particular about those not contributing content to Wikipedia.

Can we do more?

Beside reading and editing articles, users perform many other actions: they look at the revision history, search for specific content, browse through Wikipedia categories, visit portal sites to learn about specific topics, or visit the community portal. Although discussing an article is a sign of a highly engaged user, performing several actions within the same visit to Wikipedia is also a sign of a highly engaged user. It is this latter type of engagement we looked into.

Action networks

action_networkWe collected 13 months (September 2011 to September 2012) of browsing data from an anonymized sample of approximately 1.3M users.  We identified 48 actions such as reading an article, editing, opening an account, donating, visiting a special page. We then built a weighted action network: nodes are the actions and two nodes are connected by an edge if the two corresponding actions were performed during the same visit to Wikipedia. Each node has  a weight representing the number of users performing the corresponding action (the node traffic). Each edge has a weight representing the number of users that performed the two corresponding actions (the traffic between the two nodes).

Engagement over time

We use the following metrics to measure engagement on Wikipedia based on actions:

  • TotalNodeTraffic: total number of actions (sum of all node weights)
  • TotalEdgeTraffic: total number of pairwise actions (sum of all edge weights)
  • TotalTrafficRecirculation: actual network traffic with respect to maximum possible traffic (TotalEdgeTraffic/TotalNodeTraffic).

We calculated these metrics for the 13 months under consideration and plotted their variations over time. An increase in TotalNodeTraffic means that more users visited Wikipedia. An increase in TotalTrafficRecirculation means that more users performed at least two actions while on Wikipedia, our chosen indicator of high engagement in Wikipedia. We observe that TotalNodeTraffic increased first then became more or less stable. By contrast, TotalTrafficRecirculation mostly decreased, but we see a small peak in January 2011.

rcTraffic_monthlyTwo important events happened in our 13-month period. During the donation campaign (November to December 2011) more users visited Wikipedia (higher TotalNodeTraffic value). We speculate that many users became interested in Wikipedia during the campaign. However, because TotalTrafficRecirculation actually decreased for the same period, although more users visited Wikipedia, they did not perform two (or more) actions while visiting Wikiepedia; they did not become more engaged with Wikipedia. However, during the SOPA/PIPA protest (January 2012), we see a peak in TotalNodeTraffic and TotalTrafficRecirculation. More users visited Wikipedia and many users became more engaged with Wikipedia; they also read articles, gathered information about the protest, donated money while visiting Wikipedia.

rcTraffic_weekdays+endWe detected different engagement patterns on weekdays and weekends. Whereas more users visited Wikipedia during weekdays (high value of TotalNodeTraffic), users that visited Wikipedia during the weekend were more engaged (high value of TotalTrafficRecirculation). On weekends, users performed more actions during their visits.

People behave differently on weekdays compared to weekends. The same happens with Wikipedia.

Did the donation campaign make Wikipedia more engaging?

meaganmakes - 182-365+1 [cc] - 2 So which actions became more frequent as a result of the donation campaign? As expected, we observed a significant traffic increase on the “donate” node during the two months; many users made a donation. In addition, the traffic from some nodes to other nodes  increased but only slightly. Additional actions were performed;  for instance, more users created a user account, visited community-related pages, all within the same session. However, overall, users mostly performed individual actions since TotalTrafficRecirculation decreased during that time period.

So the campaign was successful in terms of donation, but less in terms of making Wikipedia more engaging.

This is a write-up of the presentation given by Janette Lehmann at TNETS Satellite, ECCS, Barcelona, September 2013.

Measuring user engagement for the “average” users and experiences: Can psychophysiological measurement help?

3081315619_fe0647a5d8_mI recently attended the Input-Output conference in Brighton, UK. The theme of the conference was “Interdisciplinary approaches to Causality in Engagement, Immersion, and Presence in Performance and Human-Computer Interaction”. I wanted to learn about  psychophysiological measurement.

I am myself on a quest: understand what is user engagement and how to measure it, with a focus on web applications with thousands to millions of users. To this end, I am looking at three measurement approaches: self-reporting (e.g., questionnaires); observational methods (e.g., facial expression analysis, mouse tracking); and of course web analytics (dwell time, page views, absence time).

Observational methods include measurement from psychophysiology, a branch of physiology that studies the relationship between physiological processes and thoughts, emotions, and behaviours. Indeed, the body responds to physiological processes: when we exercise, we sweat; when we get embarrassed, our cheeks get red and warm.

relaxCommon measurements include:

  • Event-related potentials – the electroencephalogram (EEG) is based on recordings of electrical brain activity measured at the surface of the scalp.
  • Functional magnetic resonance imaging (fMRI) – this technique involves imaging blood oxygenation using an MRI machine
  • Cardiovascular measures – heart rate (HR); beats per minute (BPM); heart rate variability (HRV).
  • Respiratory sensors – monitor oxygen intake and carbon dioxide output.
  • Electromyographic (EMG) sensors – measure electrical activity in muscles.
  • Pupillometry – measures measure variations in the diameter of the pupillary aperture of the eye in response to psychophysical and/or psychological stimuli.
  • Galvanic skin response (GSR) – measures perspiration/sweat gland activity, also called Skin Conductance Level  (SCL).
  • Temperature sensors – measure changes in blood flow and body temperature.

I learned how these measures are used, why, and some outcomes. But I started to ask myself. Yes these measures can help understanding engagement (and other related phenomena) for extreme cases, for example:
2643110825_013f4c89d4_m

  • patient with a psychiatric disorder (such as depersonalisation disorder),
  • strong emotion caused by an intense experience (a play where the audience is part of the stage, or when on a roller coaster ride), or
  • total immersion (while playing a computer game), which actually goes beyond engagement.

In my work, I am measuring user engagement for the “average” users and experiences; millions of users who visit a news site on a daily basis to consume the latest news. Can these measures tell me something?

Some recent work published in the Journal of Cyberpsychology, Behavior, and Social Networking explored many of the above measures to study the body responses of 30 healthy subjects during a 3-minute exposure to a slide show of natural panoramas (relaxation condition), their personal social network account (Facebook), and a mathematical task (stress condition). They found differences in the measures depending on the condition. Neither the subjects nor the experiences were “extreme”. However, the experiences were different enough. Can a news portal experiment with three comparably distinct conditions?

Psychophysiology measurement can help understanding user engagement and other  phenomena. But to be able to do so for the average users or experiences, we are likely to need to conduct “large-ish scale” studies to obtain significant insights.

How large-ish? I do not know.

This is in itself an interesting and important question to ask, a question to keep in mind when exploring these types of measurement, as they are still expensive to conduct, cumbersome, and obtrusive. This is a fascinating area to dive into.

Image/photo credits: The Cognitive Neuroimaging Laboratory, and Image Editor and benarent ((Creative Commons BY).

Hey Twitter crowd … What else is there?

Original and shorter post at Crowdsearch.org.

Twitter is a powerful tool for journalists at multiple stages of the news production process: to detect newsworthy events, interpret them, or verify their factual veracity. In 2011, a poll on 478 journalists from 15 countries found that 47% of them used Twitter as a source of information. Journalists and news editors also use Twitter to contextualize and enrich their articles by examining the responses to them, including comments and opinions as well as pointers to other related news. This is possible because some users in Twitter devote a substantial amount of time and effort to news curation: carefully selecting and filtering news stories highly relevant to specific audiences.

We developed an automatic method that groups together all the users who tweet a particular news item, and later detects new contents posted by them that are related to the original news item. We call each group a transient news crowd. The beauty with this, in addition to be fully automatic, is that there is no need to pre-define topics and the crowd becomes available immediately, allowing journalists to cover news beats incorporating the shifts of interest of their audiences.

Transient news crowds
Figure 1. Detection of follow-up stories related to a published article using the crowd of users that tweeted the article.

Transient news crowds
In our experiments, we define the crowd of a news article as the set of users that tweeted the article within the first 6 hours after it is published. We followed users on each crowd during one week, recording every public tweet they posted during this period. We used Twitter data around news stories published by two prominent international news portals: BBC News and Al Jazeera English.

What did we find?

  • After they tweet a news article, people’s subsequent tweets are correlated to that article during a brief period of time.
  • The correlation is weak but significant, in terms of reflecting the similarity between the articles that originate a crowd.
  • While the majority of crowds simply disperse over time, parts of some crowds come together again around new newsworthy events.

What can we do with the crowd?
Given a news crowd and a time slice, we want to find the articles in a given time slice that are related to the article that created the crowd. To accomplish this, we used a machine learning approach, which we trained on data annotated using crowd sourcing. We experimented with three types of features:

  • frequency-based: how often an article is posted by the crowd compared to other articles?
  • text-based: how similar are the two articles considering the tweets posted them?
  • user-based: is the crowd focussed on the topic of the article? does it contain influential members?

We find that the features largely complement each other. Some features are always valuable, while others contribute only in some cases. The most important features include the similarity to the original story, as well as measures of how unique is the association of the candidate article and its contributing users to the specific story’s crowd.

Crowd summarisation
We illustrate the outcome of our automatic method with the article Central African rebels advance on capital, posted on Al Jazeera on 28 December, 2012.

pic_results
Figure 2. Word clouds generated for the crowd on the article “Central African rebels advance on capital”, by considering the terms appearing in stories filtered by our system (top) and on the top stories by frequency (bottom).

Without using our method (in the figure, bottom), we obtain frequently-posted articles which are weakly related or not related at all to the original news article. Using our method (in the figure, top), we observe several follow-up articles to the original one. Four days after the news article was published, several members of the crowd tweeted an article about the fact that the rebels were considering a coalition offer. Seven days after the news article was published, crowd members posted that rebels had stopped advancing towards Bangui, the capital of the Central African Republic.

News crowds allow journalists to automatically track the development of stories. For more details you can check our papers:

  • Janette Lehmann, Carlos Castillo, Mounia Lalmas and Ethan Zuckerman: Transient News Crowds in Social Media. Seventh International AAAI Conference on Weblogs and Social Media (ICWSM), 8-10 July 2013, Cambridge, Massachusetts.
  • Janette Lehmann, Carlos Castillo, Mounia Lalmas and Ethan Zuckerman: Finding News Curators in Twitter. WWW Workshop on Social News On the Web (SNOW), Rio de Janeiro, Brazil.

Janette Lehmann, Universitat Pompeu Fabra
Carlos Castillo, Qatar Computing Research Institute
Mounia Lalmas, Yahoo! Labs Barcelona
Ethan Zuckerman, MIT Center for Civic Media

Today I am giving a keynote at the 18th International Conference on Application of Natural Language to Information Systems (NLDB2013), which is held at MediaCityUK, Salford.

I have now started to think at what are the questions to ask when evaluating user engagement. In the talk, I discuss these questions through five studies we did. Also included are questions asked when

  • evaluating serendipitous experience in the context of entity-driven search using social media such as Wikipedia and Yahoo! Answers.
  • evaluating the news reading experience when links to related articles are automatically generated using “light weight” understanding techniques.

The slides are available on Slideshare.

Relevant published papers include:

I will write about these two works in later posts.

What can absence time tell about user engagement?

Two widely employed engagement metrics are click-through rate and dwell time. These are particularly used for services where user engagement is about clicking, for example in the context of search where presumably users click on relevant results, and/or spending time on a site, for example consuming content in the context of a news portal.

In search, both have been used as indicator of relevance, and have been exploited to infer user satisfaction with their search results and improve ranking functions. However, how to properly interpret the relations between these metrics, retrieval quality and the long-term user engagement with the search application is not straightforward. Also, relying solely on clicks and time spent can  lead to contradictory if not erroneous conclusions. Indeed, with the current trend of displaying rich information on web pages, for instance the phone number of restaurants or weather data in search results, users do not need to click to access the information and the time spent on a website is shorter.

5127965259_66c1061cbb_n
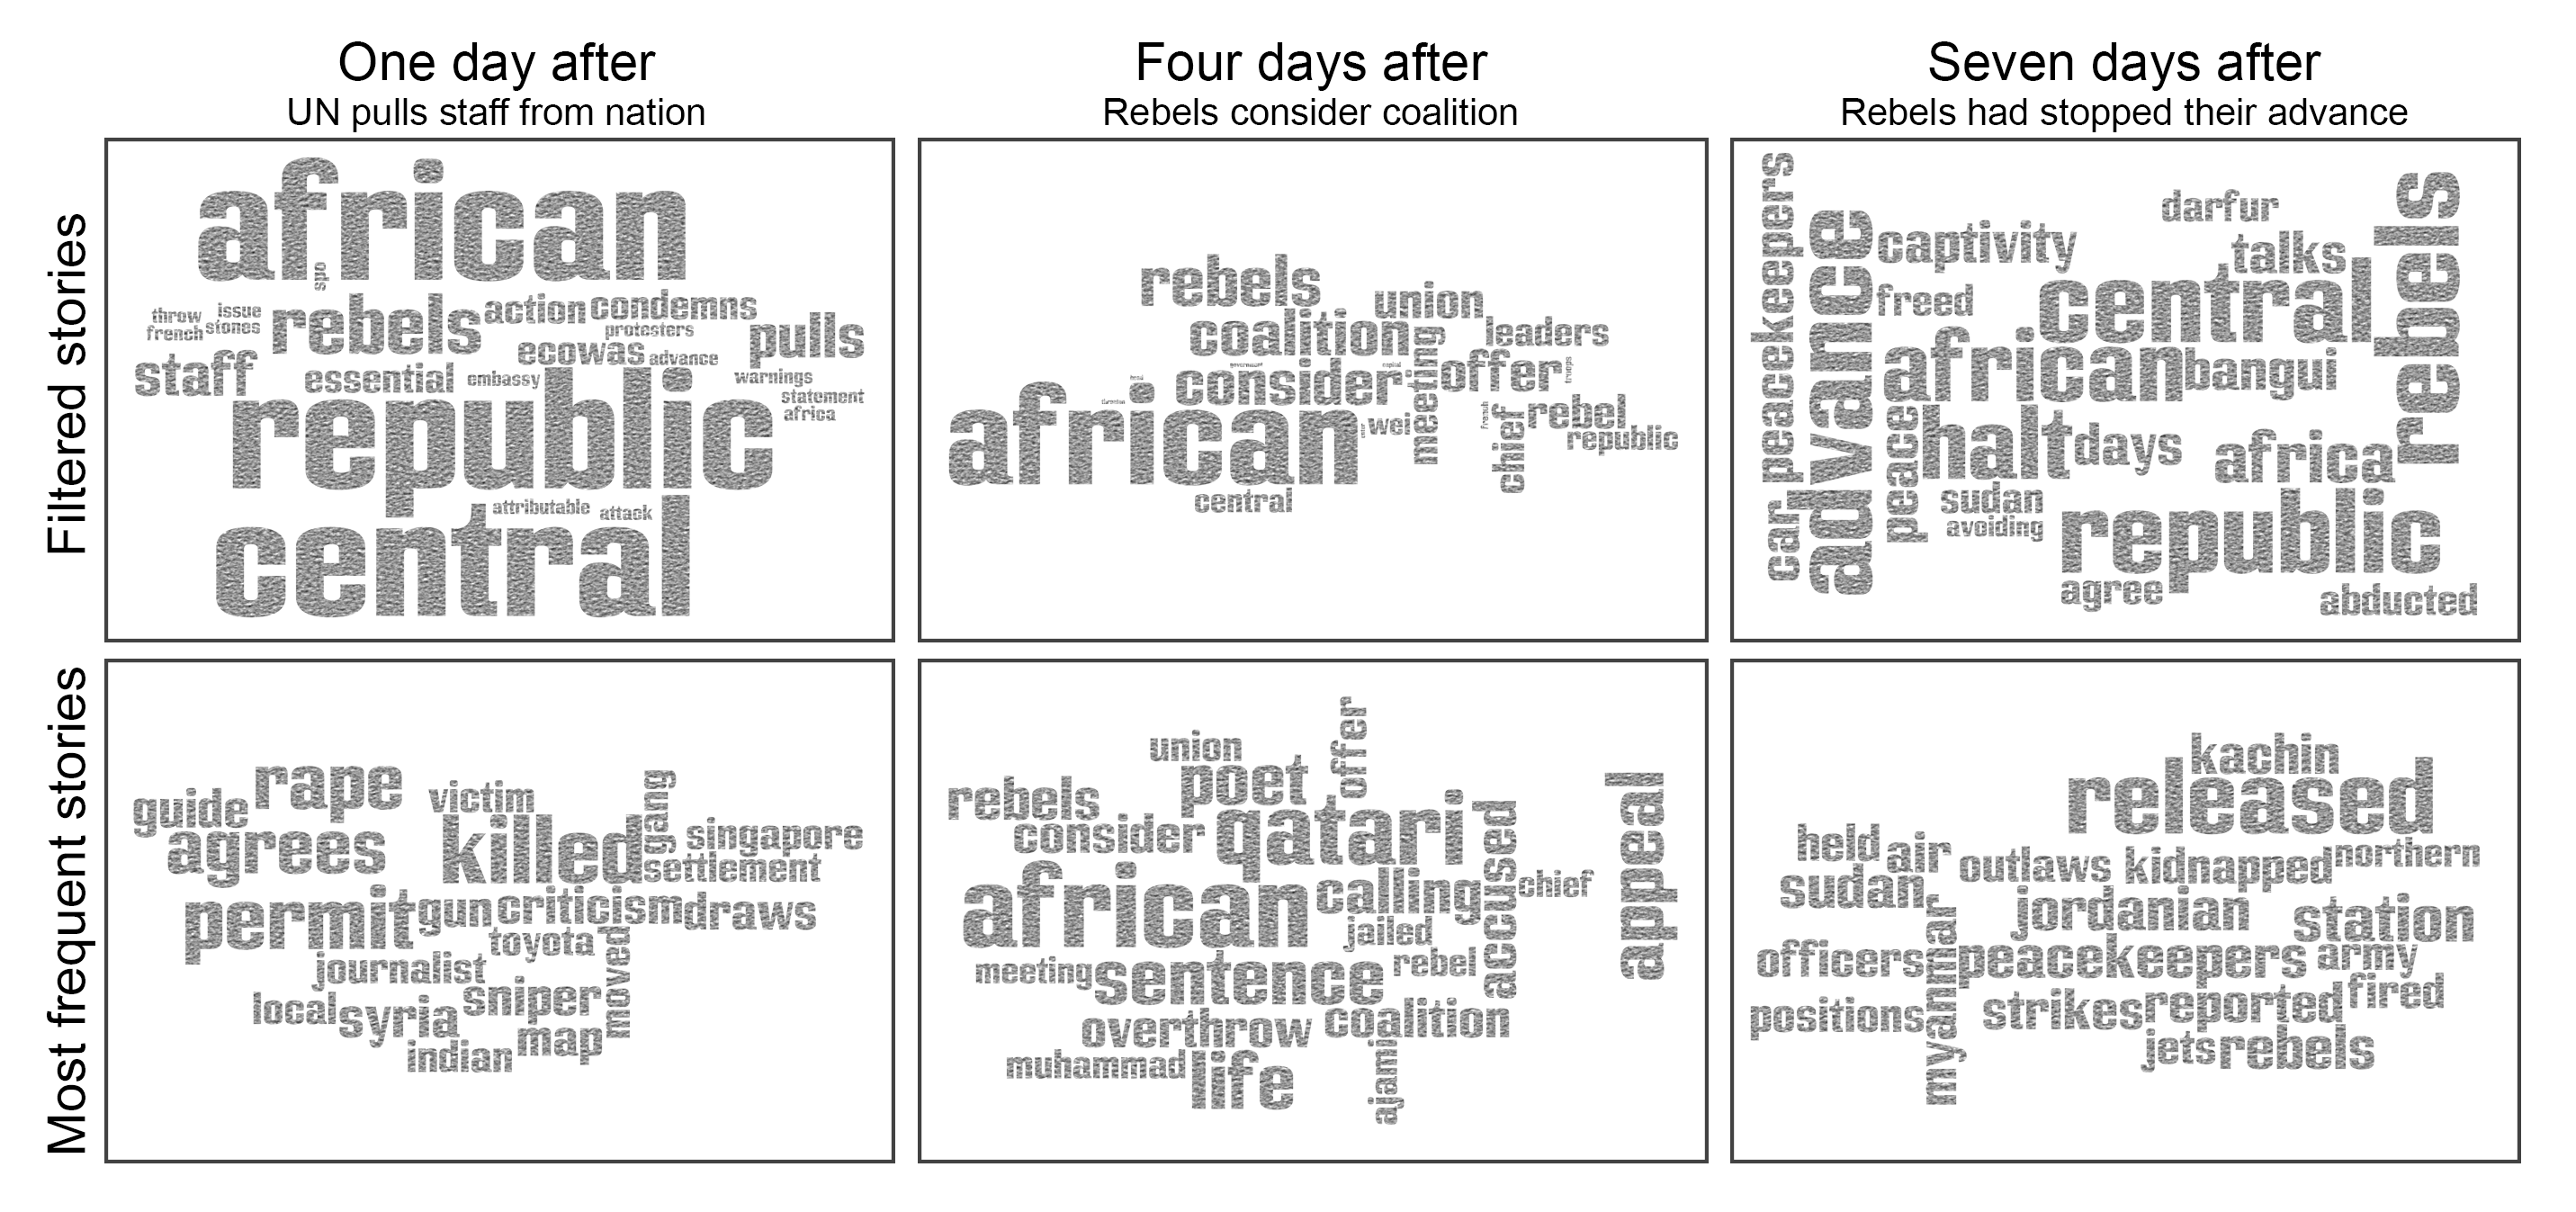
Measure: Absence time 
The absence time measures the time it takes a user to decide to return to a site to accomplish a new task. Taking a news site as an example, a good experience associated with quality articles might motivate the user to come back to that news site on a regular basis. On the other hand, if the user is disappointed, for example, the articles were not interesting, the site was confusing, he or she may return less often and even switch to an alternative news provider. Another example is a visit to a community questions and answers website. If the questions of a user are well and promptly answered, the odds are that he or she will be enticed to raise new questions and return to the site soon.

Our assumption is that if users find a site interesting, engaging or useful, they will return to it sooner.

This assumption has the advantage of being simple, intuitive and applicable to a large number of settings.

Case study: Yahoo! Answers Japan
We used a popular community querying and answering website hosted by Yahoo! Japan, where users are given the possibility to ask questions about any topic of their interest. Other users may respond by writing an answer. These answers are recorded and can be searched by any user through a standard search interface. We studied the actions of approximately one million users during two weeks.  A user action happens every time a user interacts with Yahoo! Answers: every time he or she issues a query or clicks on a link, be it an answer, an ad or a navigation button. We compare the behaviour of users exposed to six functions used to rank past answers both in term of traditional metrics and of absence time.

Methodology: Survival analysis
We use Survival Analysis to study absence time. Survival Analysis has been used in applications concerned with the death of biological organisms, each receiving different treatments. An example is throat cancer treatment where patients are administered one of several drugs and the practitioner is interested in seeing how effective the different treatments are.  The analogy with our analysis of absence time is unfortunate but nevertheless useful. We associate the user exposition to one of the ranking functions as a “treatment” and his or her survival time as the absence time. In other words, a Yahoo! Answers user dies each time he or she visits the site … but hopefully resuscitates instantly as soon as his or her visit ends.

Survival analysis makes uses of a hazard rate, which reflects the probability that a user dies at a given time. It can be very loosely understood as the speed of death of a population of patients at that  time. Returning to our example, if the hazard rate of throat cancer patients administered with say drug A is higher than the hazard rate of patients under drug B treatment, then drug B patients have a higher probability of surviving until that time. A higher hazard rate implies a lower survival rate.

We use hazard rates to compare the different ranking functions for Yahoo! Answers: a higher hazard rate translates into a short absence time and a prompter return to Yahoo! Answers, which is a sign of higher engagement. What did we find?

A better ranking does not imply more engaged users
Ranking algorithms are compared with a number of measures; a widely used one is DCG, which rewards ranking algorithms retrieving relevant results at high ranks. The higher the DCG, the better the ranking algorithm. We saw that, for the six ranking functions we compared, a higher DCG did not always translate to a higher hazard rate, or in other words, users returning to Yahoo! Answers sooner.

Returning relevant results is important, but is not the only criterion to keep users engaged with the search application.

More clicks is not always good, but no click is bad
A common assumption is that a higher number of clicks is a reflection of a higher user satisfaction with the search results. We observe that up to 5 clicks, each new click is associated with a higher hazard rate, but the increases from the third click are small. A fourth or fifth click has a very similar hazard rate. From the sixth click, the hazard rates decreases slowly.

This suggests that on average, clicks after the fifth one reflect a poorer user experience; users cannot find the information they are looking for.

We also observed that the hazard rate with five clicks or more is always higher compared with no click at all; when users search on Yahoo! Answers, no click means a bad user experience.

A click at rank 3 is better than a click at rank 1
The hazard rate is larger for clicks at ranks 2, 3 and 4, the maximum arising at rank 3, when compared to click at rank 1. For lower ranks, the trend is toward decreasing hazard.  Only the click at rank 10 was found to be clearly less valuable than a click at rank 1. It seems that users unhappy with results at earlier ranks simply click on the last displayed result, for no apparent reason apart for it being the last one on the search result page.

Clicking lower in the ranking suggests a more careful choice from the user, while clicking at the bottom is a sign that the overall ranking is of low quality.

Clicking fast on a result is a good sign
We found that the shorter the time between the search results of a query being displayed and the first click, the higher the hazard rate.

Users who find their answers quickly return sooner to the search application.

More views is worst that more queries
When users are returned search results, they may click on a result, then return back to the search result page, and then click on another result. Each display of search results generates a view. At anytime, the user may submit a new query. Both returning to the search result page several times and a higher number of query reformulations are signs that the user is not satisfied with the current search results. Which one is worse? We could see that having more views than queries was associated on average with a low hazard rate, meaning a longer absence time.

This suggests that returning to the same search result page is a worse user experience  than reformulating the query.

Without the absence time, it would have been harder to observe this, unless we asked explicitly the users to tell us what is going on.

7179266571_541698d0e5_nA small warning
A user might decide to return sooner or later to a website due to reasons unrelated with the previous visits (being on holidays for example). It is important to have a large sample of interaction data to detect coherent signals and to take systematic effects into account.

Take away message

Using absence time to measure user engagement is easy to interpret and less ambiguous than many of the commonly employed metrics. Use it and get new insights with it.

This work was done in collaboration with Georges Dupret. More details about the study can be found in  Absence time and user engagement: Evaluating Ranking Functions, which was published at the 6th ACM International Conference on Web Search and Data Mining in Rome, 2013.

Photo credits: tanfelisa and kaniths (Creative Commons BY).

We need a taxonomy of web user engagement

There are lots lots and lots of metrics that can be used to assess how users engage with a website. Widely used ones by the web-analytics community are click-through rates, number of page views, time spent on a website, how often users return to a site, number of users.

uue_engmetrics_wordle

Although these metrics cannot explicitly explain why users engage with a site, they can act as proxy for online user engagement: two millions of users accessing a website daily is a strong indication of a high engagement with that site.

Metrics, metrics and metrics

There are three main types of web-analytics metrics:

  • Popularity metrics measure how much a website is used (for example, by counting the total number of users on the site in a week). The higher the number, the more popular the website.
  • How a website is used when visited is measured with activity metrics, for example, the average number of clicks per visit across all users.
  • Loyalty metrics are concerned with how often users return to a website. An example is the return rate, calculated as the average number of times users visited a website within a month.

Loyalty and popularity metrics can be calculated on a daily, weekly or monthly basis. Activity metrics are calculated at visit level.

So one would think that a highly engaging website is one with a high number of visits (very popular), where users spend lots of time and click often (lots of activity), and return frequently (high loyalty). But not all websites, whether popular or not, have both active and loyal users.

This does not mean that user engagement on such websites is lower; it is simply different.

422362185_a260ad4ee4_q What did we do?

We collected one-month browsing data from an anonymized sample of approximately 2M users. For 80 websites, encompassing a diverse set of services such as news, weather, movies, mail, we calculated the average values of the following eight metrics:

  • Popularity metrics: number of distinct users, number of visits, and number of clicks (also called page views) for that month.
  • Activity metrics: average number of page views per visit and average time per visit (also called dwell time).
  • Loyalty metrics: number of days a user visited the site, number of times a user visited the site, and average time a user spend on the site, for that month.

Websites differ widely in terms of their engagement

Some websites are very popular (for example, news portals) whereas others are visited by small groups of users (lots of specific-interest websites were this way). Visit activity also depends on the websites. For instance, search sites tend to have a much shorter dwell time than sites related to entertainment (where people play games). Loyalty per website differed as well. Media (news, magazines) and communication (messenger, mail) sites have many users returning to them much more regularly, than sites containing information of temporary interests (e-commerce site selling cars). Loyalty is also influenced by the frequency in which new content is published. Indeed, some sites produce new content once per week.

High popularity did not entail high activity. Many site have many users spending little time on them. A good example is of a search site, where users come, submit a query, get the result, and if satisfied, leave the site.

This results in a low dwell time even though user expectations were entirely met.

The same holds for a site on Q&A, or a weather site. What matters for such sites is their popularity.

Any patterns? Yes … 

To identify engagement patterns, we grouped the 80 sites using clustering approaches applied to the eight engagement metrics. We also extracted for each group which metrics and their values (whether high or low) were specific to that group. This process generated five groups with clear engagement patterns, and a sixth group with none:

  • Sites where the main factor was their high popularity (for example as measured by the high numbers of users). Examples of sites following this pattern include media sites providing daily news and search sites. Those are sites where users interact in various ways with them; what is common is that they are used by many users.
  • Sites with low popularity, for instance having a low number of visits. Many interest-specific sites followed this pattern. Those sites center around niche topics or services, which do not attract a large number of users.
  • Sites with a high number of clicks per visit. This pattern was followed by e-commerce and configuration (accessed by users to update their profiles for example) sites, where the main activity is to click.
  • Sites with high dwell time and low clicks per visit, and with low loyalty. This pattern was followed by domain-specific media sites of periodic nature (new content published on a weekly basis), which are therefore not often accessed. However when accessed, users spend more time to consume their content. The design of such sites (compared to mainstream media sites) leads to such type of engagement, since new content was typically published on their homepage. Thus users are not enticed to reach (if any) additional content.
  • Sites with high loyalty, small dwell time and few clicks. This pattern was followed by navigational sites (the front page of an Internet company), which role is to direct users to interesting content or service in other sites (of that same company); what matters is that users come regularly to them.

This simple study (80 sites and 8 metrics) identified several patterns of user engagement.

However, sites of the same type do not necessarily follow the same engagement pattern.

For instance, not all mainstream media sites followed the first pattern (high popularity). It is likely that, among others, the structure of the site has an effect.

Green apples measured  the meter, sports apples                                          … So what now?

We must study way more sites and include lots more engagement metrics. This is the only way to build, if we want, and we should, a taxonomy of web user engagement. With a taxonomy, we will know the best metrics to measure engagement on a site.

Counting clicks may be totally useless for some sites. But if not, and the number of clicks is for instance way too low, knowing which engagement pattern a site follows helps making the appropriate changes to the site.

This work was done in collaboration with Janette Lehmann, Elad Yom-Tov and Georges Dupret. More details about the study can be found in  Models of User Engagement, a paper presented at the 20th conference on User Modeling, Adaptation, and Personalization (UMAP), 2012.

Photo credits: Denis Vrublevski and matt hutchinson (Creative Commons BY).

Together with Heather O’Brien and Elad Yom-Tov, we will be giving a tutorial at the International World-Wide Web Conference (WWW), 13-17 May 2013, Rio de Janeiro.

The slides are now available on Slideshare.
You can also access the two-slides per page format (PDF) here: MeasuringUserEngagement or one-slide per page format (PDF) here.
The references can be found here: References_Tutorial.

We will continue updating the slides, correct any errors and so on. Feedback very welcome.

Measuring User Engagement

Together with Heather O’Brien and Elad Yom-Tov, we will be giving a tutorial at the International World-Wide Web Conference (WWW), 13-17 May 2013, Rio de Janeiro. Here is a description of our tutorial. We will add slides and a bibliography soon.

Introduction and Motivations
In the online world, user engagement refers to the quality of the user experience that emphasizes the positive aspects of the interaction with a web application and, in particular, the phenomena associated with wanting to use that application longer and frequently. User engagement is a key concept in the design of web applications, motivated by the observation that successful applications are not just used, but are engaged with. Users invest time, attention, and emotion in their use of technology, and it must satisfy both their pragmatic and hedonic needs and expectations. Measurement is key for evaluating the success of information technologies, and is particularly critical to any web applications, from media to e-commerce sites, as it informs our understanding of user needs and expectations, system design and functionality. For instance, news portals have become a very popular destination for web users who read news online. As there is great potential for online news consumption but also serious competition among news portals, online news providers strive to develop effective and efficient strategies to engage users longer in their sites. Measuring how users engage with a news portal can inform the portal if there are areas that need to be enhanced, if current optimization techniques are still effective, if the published material triggers user behavior that causes engagement with the portal, etc. Understanding the above is dependent upon the ability to measure user engagement. The focus of this tutorial is how user engagement is currently being measured and future considerations for its measurement.

User engagement is a multifaceted, complex phenomenon; this gives rise to a number of potential approaches for its measurement, both objective and subjective. Common ways of measuring user engagement include: self-reporting, e.g., questionnaires; observational methods, such as facial expression analysis, speech analysis, desktop actions, etc.; neuro-physiological signal processing methods, e.g., respiratory and cardiovascular accelerations and decelerations, muscle spasms, etc.; and web analytics, online behavior metrics that assess users’ depth of engagement with a site. These methods represent various tradeoffs between the scale of data analyzed and the depth of understanding. For instance, surveys are small-scale but deep, whereas clicks can be collected on a large-scale but provide shallow understanding.

The tutorial will start with a definition of user engagement and discuss the challenges associated with its measurement. The tutorial will then have two main parts. Part I will describe self-report measures, physiological measures, and web analytics. We aim to provide a full understanding of each type of approach, including methodological aspects, concrete findings, and advantages and disadvantages. Part II will concentrate on advanced aspects of user engagement measurement, and is comprised of three sub-sections. We will look at (1) how current metrics may or may not apply to the mobile environment; (2) the relationship between user engagement on-site with other sites in terms of user traffic or stylistics; and finally (3) the integration of various approaches for measuring engagement as a means of providing a deeper and more coherent understanding of engagement success. The tutorial will end with some conclusions, open research problems, and suggestions for future research and development.

Part I – Foundations

Approaches based on Self-Report Measures
Questionnaires are one of the most common ways of gathering information about the user experience. Although self-report measures are subjective in nature, they have several advantages, including being convenient and easy to administer, and capturing users’ perceptions of an experience at a particular point in time. The fundamental problem is that questionnaires are seldom subjected to rigorous evaluation. The User Engagement Scale (UES), a self-report measure developed by O’Brien and colleagues in 2010 will be used to discuss issues of reliability and validity with self-report measures. The UES consists of six underlying dimensions: Aesthetic Appeal, Perceived Usability, Focused Attention, Felt Involvement, Novelty, and Endurability (i.e., users’ overall evaluation). It has been used in online web surveys and user studies to assess engagement with e-commerce, wiki search, multimedia presentations, academic reading environments, and online news. Data analysis has focused on statistically analyzing the reliability and component structure of the UES, and on examining the relationship between the UES and other self-report measures, performance, and physiological measures. These findings will be shared, and the benefits and drawbacks of the UES for measuring engagement will be explored.

Approaches based physiological measures
Physiological data can be captured by a broad range of sensors related to different cognitive states. Examples of sensors are eye trackers (e.g., difficulty, attention, fatigue, mental activity, strong emotion), mouse pressure (stress, certainty of response), biosensors (e.g., temperature for negative affect and relaxation, electrodermal for arousal, blood flow for stress and emotion intensity), oximiters (e.g., pulse), camera (e.g., face tracking for general emotion detection). Such sensors have several advantages over questionnaires or online behaviour, since they are more directly connected to the emotional state of the user, are more objective (measuring involuntary body responses) and they are continuously measured. They are, however, more invasive and, apart from mouse tracking, cannot be used on a large-scale. They can nonetheless be highly indicative of immersive states through their links with attention, affect, the perception of aesthetics and novelty – all of which are important characteristics of user engagement. A particular focus in this tutorial will be the usage of mouse pressure, so-called mouse tracking, because of its potential for large-scale measurement. The use of eye-tracking to measure engagement will also be discussed, because of its relationship to mouse movement.

Approaches based on web analytic
The most common way that engagement is measured, especially in production websites, is through various proxy measures of user engagement. Standard metrics include the number of page views, number of unique users, dwell time, bounce rate, and click-through rate. In addition, with the explosion of user-generated content, the number of comments and social network “like” buttons are also becoming widely used measures of web service performance. In this part we will review these measures, and discuss what they measure vis-à-vis user engagement, and consequently their advantages and drawbacks. We will provide extensive details on the appropriateness of these metrics to various websites. Finally, we will discuss recent work on combining these measures to form single measures of user engagement.

Part II – Advanced Aspects

Measuring User Engagement in Mobile Information Searching
Mobile use is a growing area of interest with respect to user engagement. Mobile devices are utilized in dynamic and shifting contexts that form the fabric of everyday life, their portability and functionality make them more suited to some tasks than others, and they are often used in the presence of other people. All of these considerations – context, task, and social situatedness – have implications for user engagement. The Engagement Lab at the University of British Columbia is exploring user engagement with mobile devices in a series of studies. In this section of the tutorial, we will explore the ways in which mobile engagement may differ from engagement with other devices and what the implications of this are for measurement. We will describe both lab and field-based work that we are undertaking, and the measures that we are selecting to capture mobile engagement.

Networked User Engagement
Nowadays, many providers operate multiple content sites, which are very different from each other. For example, Yahoo! operates sites on finance, sports, celebrities, and shopping. Due to the varied content served by these sites, it is difficult to treat them as a single entity. For this reason, they are usually studied and optimized separately. However, user engagement should be examined not only within individual sites, but also across sites, that is the entire content provider network. Such engagement was recently defined by Lalmas et al. as “Networked User Engagement”. In this part of the tutorial we will present recent findings on the optimization of networked user engagement. We will demonstrate the effect of the network on user engagement, and show how changes in elements of websites can increase networked user engagement.

Combining different approaches
Little work has been done to integrate these various measures. It is important to combine insights from big data with deep analysis of human behavior in the lab, or through crowd-sourcing experiments, to obtain a coherent understanding of engagement success. However, a number of initiatives aiming to combine techniques from web analytics, existing works on user engagement coming from the domains of information science, multimodal human computer interaction and cognitive psychology, are emerging. We will discuss work emerging in these directions, and in particular studies related to mapping mouse tracking and qualitative measurement of user engagement, and the challenges in designing experiments, and interpreting and generalizing results.